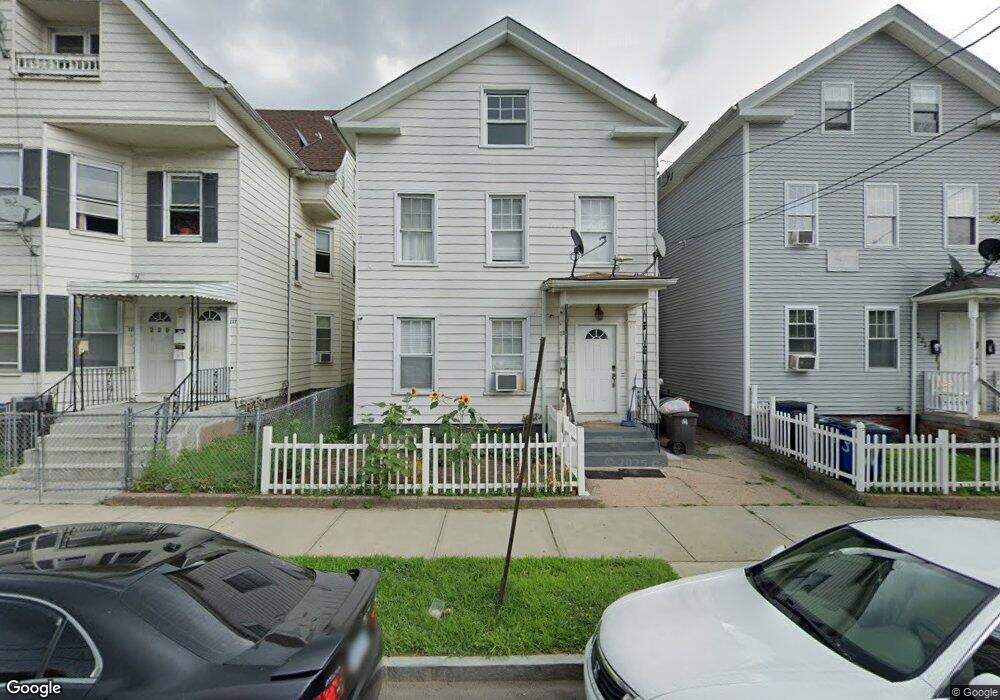
225 Lloyd St New Haven, CT 06513
Fair Haven NeighborhoodEstimated Value: $264,000 - $376,000
5
Beds
3
Baths
1,980
Sq Ft
$170/Sq Ft
Est. Value
About This Home
This home is located at 225 Lloyd St, New Haven, CT 06513 and is currently estimated at $336,301, approximately $169 per square foot. 225 Lloyd St is a home located in New Haven County with nearby schools including Elm City College Preparatory School, Cold Spring School, and All Saints Catholic Academy.
Ownership History
Date
Name
Owned For
Owner Type
Purchase Details
Closed on
Oct 22, 2004
Sold by
Fair Haven Dev Corp
Bought by
Muniz Yolanda
Current Estimated Value
Home Financials for this Owner
Home Financials are based on the most recent Mortgage that was taken out on this home.
Original Mortgage
$89,500
Outstanding Balance
$44,562
Interest Rate
5.85%
Estimated Equity
$291,739
Purchase Details
Closed on
May 23, 2003
Sold by
Burns-Petro Elisa
Bought by
Fair Haven Dev Corp
Create a Home Valuation Report for This Property
The Home Valuation Report is an in-depth analysis detailing your home's value as well as a comparison with similar homes in the area
Home Values in the Area
Average Home Value in this Area
Purchase History
| Date | Buyer | Sale Price | Title Company |
|---|---|---|---|
| Muniz Yolanda | $122,000 | -- | |
| Fair Haven Dev Corp | $48,000 | -- |
Source: Public Records
Mortgage History
| Date | Status | Borrower | Loan Amount |
|---|---|---|---|
| Open | Fair Haven Dev Corp | $89,500 | |
| Closed | Fair Haven Dev Corp | $30,000 | |
| Closed | Fair Haven Dev Corp | $5,000 |
Source: Public Records
Tax History
| Year | Tax Paid | Tax Assessment Tax Assessment Total Assessment is a certain percentage of the fair market value that is determined by local assessors to be the total taxable value of land and additions on the property. | Land | Improvement |
|---|---|---|---|---|
| 2025 | $5,381 | $136,570 | $34,650 | $101,920 |
| 2024 | $5,258 | $136,570 | $34,650 | $101,920 |
| 2023 | $5,080 | $136,570 | $34,650 | $101,920 |
| 2022 | $5,429 | $136,570 | $34,650 | $101,920 |
| 2021 | $3,477 | $79,240 | $27,720 | $51,520 |
| 2020 | $3,477 | $79,240 | $27,720 | $51,520 |
| 2019 | $3,406 | $79,240 | $27,720 | $51,520 |
| 2018 | $3,406 | $79,240 | $27,720 | $51,520 |
| 2017 | $3,065 | $79,240 | $27,720 | $51,520 |
| 2016 | $2,373 | $57,120 | $13,440 | $43,680 |
| 2015 | $2,373 | $57,120 | $13,440 | $43,680 |
| 2014 | $2,373 | $57,120 | $13,440 | $43,680 |
Source: Public Records
Map
Nearby Homes
Your Personal Tour Guide
Ask me questions while you tour the home.