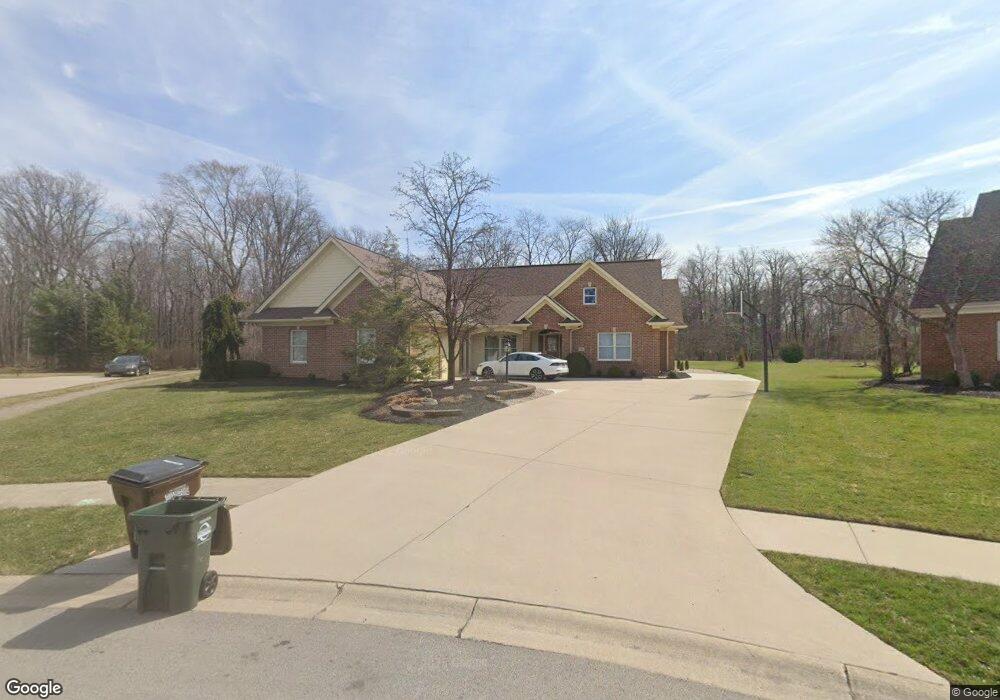
225 Locust Ct Bluffton, OH 45817
Estimated Value: $481,475 - $567,000
3
Beds
3
Baths
2,481
Sq Ft
$212/Sq Ft
Est. Value
About This Home
This home is located at 225 Locust Ct, Bluffton, OH 45817 and is currently estimated at $526,119, approximately $212 per square foot. 225 Locust Ct is a home located in Allen County with nearby schools including Bluffton Elementary School, Bluffton Middle School, and Bluffton High School.
Ownership History
Date
Name
Owned For
Owner Type
Purchase Details
Closed on
Dec 22, 2011
Sold by
Emans Kurt D and Emans Valerie A
Bought by
Heslep Nathan E and Heslep Annette L
Current Estimated Value
Home Financials for this Owner
Home Financials are based on the most recent Mortgage that was taken out on this home.
Original Mortgage
$232,000
Outstanding Balance
$25,083
Interest Rate
4.01%
Mortgage Type
New Conventional
Estimated Equity
$501,036
Purchase Details
Closed on
Jan 4, 2005
Sold by
Sehlhorst Jeanne Lynn
Bought by
Emans Kurt D and Emans Valerie A
Home Financials for this Owner
Home Financials are based on the most recent Mortgage that was taken out on this home.
Original Mortgage
$274,500
Interest Rate
5.78%
Mortgage Type
New Conventional
Purchase Details
Closed on
Jun 26, 1997
Sold by
Clemens Dev Systems
Bought by
Sehlorst Henry and Sehlorst Jeanne
Create a Home Valuation Report for This Property
The Home Valuation Report is an in-depth analysis detailing your home's value as well as a comparison with similar homes in the area
Home Values in the Area
Average Home Value in this Area
Purchase History
| Date | Buyer | Sale Price | Title Company |
|---|---|---|---|
| Heslep Nathan E | $310,000 | None Available | |
| Emans Kurt D | $305,000 | None Available | |
| Sehlorst Henry | $40,000 | -- |
Source: Public Records
Mortgage History
| Date | Status | Borrower | Loan Amount |
|---|---|---|---|
| Open | Heslep Nathan E | $232,000 | |
| Closed | Emans Kurt D | $274,500 |
Source: Public Records
Tax History
| Year | Tax Paid | Tax Assessment Tax Assessment Total Assessment is a certain percentage of the fair market value that is determined by local assessors to be the total taxable value of land and additions on the property. | Land | Improvement |
|---|---|---|---|---|
| 2024 | $4,852 | $146,510 | $6,930 | $139,580 |
| 2023 | $4,996 | $139,550 | $6,620 | $132,930 |
| 2022 | $5,032 | $139,550 | $6,620 | $132,930 |
| 2021 | $5,068 | $139,550 | $6,620 | $132,930 |
| 2020 | $4,524 | $112,740 | $6,270 | $106,470 |
| 2019 | $4,524 | $112,740 | $6,270 | $106,470 |
| 2018 | $4,190 | $112,740 | $6,270 | $106,470 |
| 2017 | $3,824 | $95,000 | $6,270 | $88,730 |
| 2016 | $3,825 | $95,000 | $6,270 | $88,730 |
| 2015 | $4,231 | $95,000 | $6,270 | $88,730 |
| 2014 | $4,231 | $101,680 | $6,620 | $95,060 |
| 2013 | $3,929 | $101,680 | $6,620 | $95,060 |
Source: Public Records
Map
Nearby Homes
- 160 Chestnut Ln
- 110 Magnolia Ln
- 0 Columbus Grove-Bluffton Rd
- 217 Grove St
- 218 S Jackson St
- 513 S Jackson St
- 307 Parkview Dr
- 305 Parkview Dr
- 222 N Lawn Ave
- 303 Parkview Dr
- 315 Parkview Dr
- 301 Parkview Dr
- 317 Parkview Dr
- 319 Parkview Dr
- 321 Parkview Dr
- 307 S Main St Unit back
- 210 N Jackson St
- 327 Parkview Dr
- 329 Parkview Dr
- 331 Parkview Dr
Your Personal Tour Guide
Ask me questions while you tour the home.