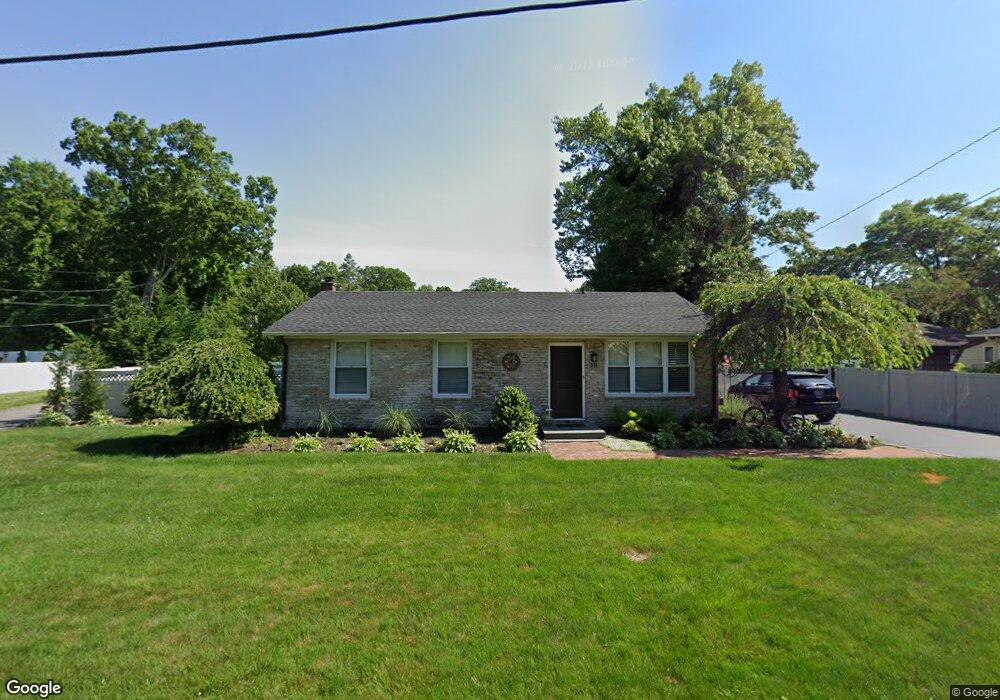
225 Locust Dr Rocky Point, NY 11778
Estimated Value: $490,000 - $516,000
3
Beds
1
Bath
1,120
Sq Ft
$448/Sq Ft
Est. Value
About This Home
This home is located at 225 Locust Dr, Rocky Point, NY 11778 and is currently estimated at $502,122, approximately $448 per square foot. 225 Locust Dr is a home located in Suffolk County with nearby schools including Joseph A Edgar Imtermediate School, Frank J. Carasiti Elementary School, and Rocky Point Middle School.
Ownership History
Date
Name
Owned For
Owner Type
Purchase Details
Closed on
Dec 1, 2009
Sold by
Csorba Paul S
Bought by
Smith Kama D
Current Estimated Value
Home Financials for this Owner
Home Financials are based on the most recent Mortgage that was taken out on this home.
Original Mortgage
$247,250
Outstanding Balance
$160,274
Interest Rate
4.78%
Mortgage Type
FHA
Estimated Equity
$341,848
Purchase Details
Closed on
Apr 15, 2002
Sold by
Opiela Steven and Opiela Doreen
Bought by
Csorba Paul S
Home Financials for this Owner
Home Financials are based on the most recent Mortgage that was taken out on this home.
Original Mortgage
$156,000
Interest Rate
6.84%
Purchase Details
Closed on
Aug 11, 2000
Sold by
Pirraglia Thomas and Pirraglia Lauretta
Bought by
Opiela Steven and Opiela Doreen
Home Financials for this Owner
Home Financials are based on the most recent Mortgage that was taken out on this home.
Original Mortgage
$150,000
Interest Rate
8.06%
Purchase Details
Closed on
Feb 10, 1995
Sold by
Aliano Nicholas
Bought by
Pirraglia Thomas
Purchase Details
Closed on
May 10, 1994
Sold by
Mckay Daniel P and Drago Mckay Donna L
Bought by
Pirraglia Thomas and Pirraglia Lauretta
Home Financials for this Owner
Home Financials are based on the most recent Mortgage that was taken out on this home.
Original Mortgage
$116,842
Interest Rate
7.98%
Create a Home Valuation Report for This Property
The Home Valuation Report is an in-depth analysis detailing your home's value as well as a comparison with similar homes in the area
Home Values in the Area
Average Home Value in this Area
Purchase History
| Date | Buyer | Sale Price | Title Company |
|---|---|---|---|
| Smith Kama D | $270,000 | -- | |
| Csorba Paul S | $203,000 | First American Title Ins Co | |
| Opiela Steven | $165,000 | Fidelity National Title Ins | |
| Pirraglia Thomas | $48,500 | First American Title Ins Co | |
| Pirraglia Thomas | -- | Chicago Title Insurance Co |
Source: Public Records
Mortgage History
| Date | Status | Borrower | Loan Amount |
|---|---|---|---|
| Open | Smith Kama D | $247,250 | |
| Previous Owner | Csorba Paul S | $155,236 | |
| Previous Owner | Csorba Paul S | $15,000 | |
| Previous Owner | Csorba Paul S | $156,000 | |
| Previous Owner | Opiela Steven | $150,000 | |
| Previous Owner | Pirraglia Thomas | $116,842 |
Source: Public Records
Tax History Compared to Growth
Tax History
| Year | Tax Paid | Tax Assessment Tax Assessment Total Assessment is a certain percentage of the fair market value that is determined by local assessors to be the total taxable value of land and additions on the property. | Land | Improvement |
|---|---|---|---|---|
| 2024 | $9,566 | $2,325 | $240 | $2,085 |
| 2023 | $9,566 | $2,325 | $240 | $2,085 |
| 2022 | $8,385 | $2,325 | $240 | $2,085 |
| 2021 | $8,385 | $2,325 | $240 | $2,085 |
| 2020 | $8,553 | $2,325 | $240 | $2,085 |
| 2019 | $8,553 | $0 | $0 | $0 |
| 2018 | $8,068 | $2,325 | $240 | $2,085 |
| 2017 | $8,068 | $2,325 | $240 | $2,085 |
| 2016 | $7,890 | $2,325 | $240 | $2,085 |
| 2015 | -- | $2,325 | $240 | $2,085 |
| 2014 | -- | $2,325 | $240 | $2,085 |
Source: Public Records
Map
Nearby Homes