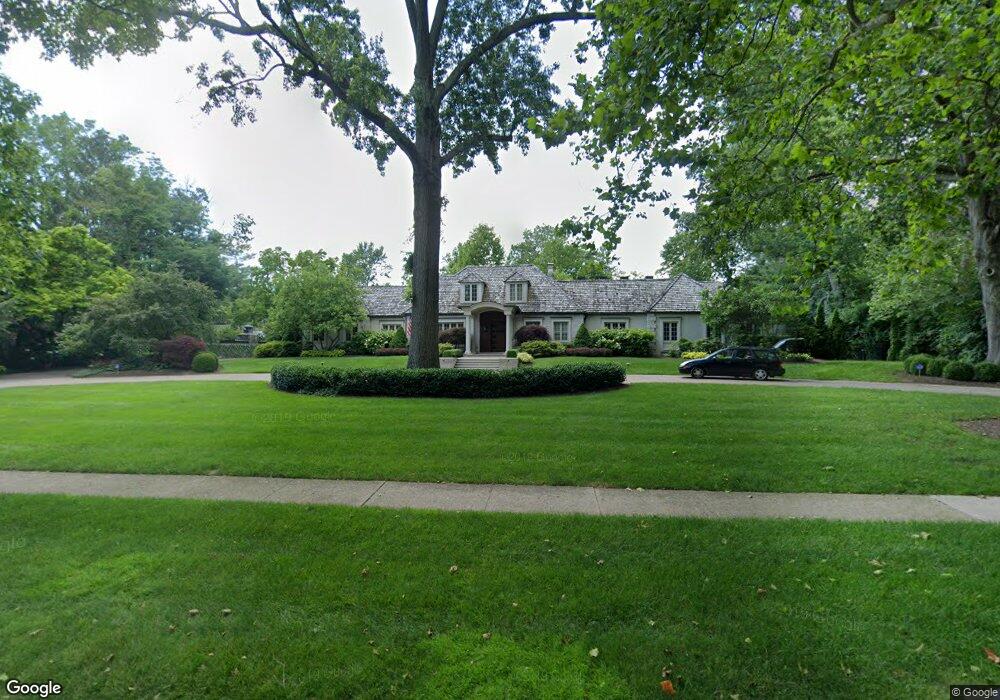
225 N Columbia Ave Columbus, OH 43209
Estimated Value: $1,994,000 - $2,338,000
4
Beds
5
Baths
5,526
Sq Ft
$382/Sq Ft
Est. Value
About This Home
This home is located at 225 N Columbia Ave, Columbus, OH 43209 and is currently estimated at $2,113,402, approximately $382 per square foot. 225 N Columbia Ave is a home located in Franklin County with nearby schools including Maryland Elementary School, Bexley Middle School, and Bexley High School.
Ownership History
Date
Name
Owned For
Owner Type
Purchase Details
Closed on
Aug 12, 2011
Sold by
Skilken Marilyn M
Bought by
Kastan Holly S
Current Estimated Value
Purchase Details
Closed on
Jan 31, 2007
Sold by
Schottenstein Eric J and Kastan Holly Schottenstein
Bought by
Skilken Marilyn M
Home Financials for this Owner
Home Financials are based on the most recent Mortgage that was taken out on this home.
Original Mortgage
$800,000
Interest Rate
6.37%
Mortgage Type
Purchase Money Mortgage
Purchase Details
Closed on
Nov 20, 2000
Sold by
Sagner Lenore G
Bought by
Sagner Lenore G
Purchase Details
Closed on
Mar 26, 1997
Sold by
Schottenstein Eric J
Bought by
Lenore G Sagner
Purchase Details
Closed on
Nov 2, 1993
Purchase Details
Closed on
Sep 1, 1978
Create a Home Valuation Report for This Property
The Home Valuation Report is an in-depth analysis detailing your home's value as well as a comparison with similar homes in the area
Home Values in the Area
Average Home Value in this Area
Purchase History
| Date | Buyer | Sale Price | Title Company |
|---|---|---|---|
| Kastan Holly S | $1,175,000 | Hummel Titl | |
| Skilken Marilyn M | $1,200,000 | Builders Ti | |
| Sagner Lenore G | -- | -- | |
| Lenore G Sagner | $900,000 | -- | |
| -- | $420,000 | -- | |
| -- | $164,000 | -- |
Source: Public Records
Mortgage History
| Date | Status | Borrower | Loan Amount |
|---|---|---|---|
| Previous Owner | Skilken Marilyn M | $800,000 |
Source: Public Records
Tax History Compared to Growth
Tax History
| Year | Tax Paid | Tax Assessment Tax Assessment Total Assessment is a certain percentage of the fair market value that is determined by local assessors to be the total taxable value of land and additions on the property. | Land | Improvement |
|---|---|---|---|---|
| 2024 | $33,477 | $602,840 | $177,520 | $425,320 |
| 2023 | $30,099 | $602,840 | $177,520 | $425,320 |
| 2022 | $30,466 | $490,070 | $132,090 | $357,980 |
| 2021 | $30,491 | $490,070 | $132,090 | $357,980 |
| 2020 | $30,222 | $490,070 | $132,090 | $357,980 |
| 2019 | $31,179 | $444,820 | $120,090 | $324,730 |
| 2018 | $27,545 | $444,820 | $120,090 | $324,730 |
| 2017 | $27,178 | $444,820 | $120,090 | $324,730 |
| 2016 | $27,918 | $429,210 | $129,010 | $300,200 |
| 2015 | $28,000 | $429,210 | $129,010 | $300,200 |
| 2014 | $28,159 | $429,210 | $129,010 | $300,200 |
| 2013 | $13,751 | $403,200 | $117,285 | $285,915 |
Source: Public Records
Map
Nearby Homes
- 189 N Parkview Ave
- 291 N Drexel Ave
- 440 N Nelson Rd
- 82 Bishop Square
- 49 N Cassingham Rd
- 1993 Greenway Ave N
- 57 Preston Rd
- 96 N Cassingham Rd
- 2629 E Broad St
- 2695 Bellwood Ave
- 2717 E Broad St
- 2738 E Broad St
- 1872 Greenway Ave S
- 2731 E Broad St
- 2779 Columbus Ave
- 2287 Margaret Ave Unit 289
- 2455 Dale Ave
- 797 N Nelson Rd
- 268 S Cassady Ave
- 2867 Ruhl Ave Unit 869
- 253 N Columbia Ave
- 2326 Commonwealth Park N
- 2340 Commonwealth Park N
- 244 N Parkview Ave
- 2300 Commonwealth Park N
- 258 N Parkview Ave
- 268 N Parkview Ave
- 200 N Columbia Ave
- 236 N Columbia Ave
- 218 N Parkview Ave
- 2327 Boston Ave
- 279 N Columbia Ave
- 301 N Parkview Ave
- 260 N Columbia Ave
- 290 N Parkview Ave
- 2388 Commonwealth Park N
- 171 N Columbia Ave
- 219 N Drexel Ave
- 201 N Drexel Ave
- 201 N Drexel Ave