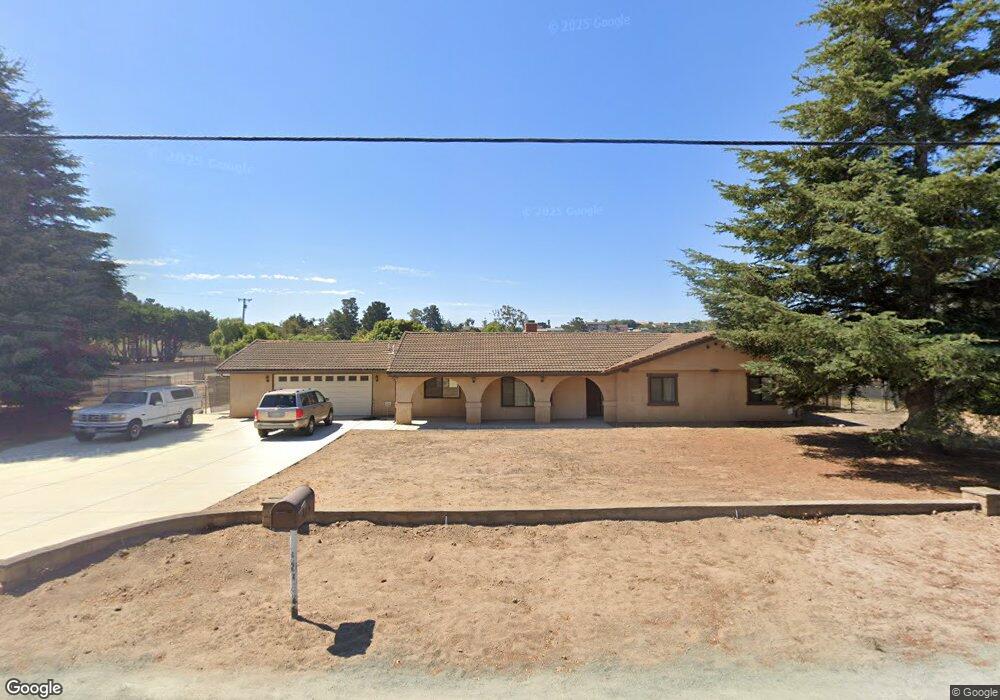
225 N Las Flores Dr Nipomo, CA 93444
Estimated Value: $878,000 - $1,359,000
3
Beds
3
Baths
1,759
Sq Ft
$609/Sq Ft
Est. Value
About This Home
This home is located at 225 N Las Flores Dr, Nipomo, CA 93444 and is currently estimated at $1,071,987, approximately $609 per square foot. 225 N Las Flores Dr is a home located in San Luis Obispo County with nearby schools including Dorothea Lange Elementary School, Mesa Middle School, and Nipomo High School.
Ownership History
Date
Name
Owned For
Owner Type
Purchase Details
Closed on
Apr 20, 2016
Sold by
Bhare Marilyn Anne
Bought by
Bhare Marilyn Anne
Current Estimated Value
Purchase Details
Closed on
Oct 15, 2015
Sold by
Bhare Ronald Russell
Bought by
Bhare Ronald Russell and Bhare Marilyn Anne
Create a Home Valuation Report for This Property
The Home Valuation Report is an in-depth analysis detailing your home's value as well as a comparison with similar homes in the area
Home Values in the Area
Average Home Value in this Area
Purchase History
| Date | Buyer | Sale Price | Title Company |
|---|---|---|---|
| Bhare Marilyn Anne | -- | None Available | |
| Bhare Ronald Russell | -- | None Available |
Source: Public Records
Tax History
| Year | Tax Paid | Tax Assessment Tax Assessment Total Assessment is a certain percentage of the fair market value that is determined by local assessors to be the total taxable value of land and additions on the property. | Land | Improvement |
|---|---|---|---|---|
| 2025 | $2,407 | $241,161 | $53,828 | $187,333 |
| 2024 | $2,378 | $236,433 | $52,773 | $183,660 |
| 2023 | $2,378 | $231,798 | $51,739 | $180,059 |
| 2022 | $2,341 | $227,254 | $50,725 | $176,529 |
| 2021 | $2,335 | $222,799 | $49,731 | $173,068 |
| 2020 | $2,308 | $220,516 | $49,222 | $171,294 |
| 2019 | $2,292 | $216,193 | $48,257 | $167,936 |
| 2018 | $2,263 | $211,955 | $47,311 | $164,644 |
| 2017 | $2,219 | $207,800 | $46,384 | $161,416 |
| 2016 | $2,166 | $203,726 | $45,475 | $158,251 |
| 2015 | $2,135 | $200,666 | $44,792 | $155,874 |
| 2014 | $2,056 | $196,736 | $43,915 | $152,821 |
Source: Public Records
Map
Nearby Homes
- 340 N Las Flores Dr
- 341 N Las Flores Dr
- 250 Via Promesa
- 366 Venus Ct
- 585 Via Mira Valle
- 1655 Kirby Way
- 1765 Division St
- 353 Uranus Ct
- 161 Lot Scenic View Way
- 0 Scenic View Way
- 1685 Scenic View Way
- 468 Neptune Dr
- 429 Saturn Ct
- 461 Saturn Ct
- 270 S Tejas Place
- 945 Jeanette Ln
- 1089 Olympic Way
- 680 Sweet Donna Place
- 375 Kestrel Way
- 345 Black Hawk Way
- 245 N Las Flores Dr Unit LAS
- 245 N Las Flores Dr
- 230 N Las Flores Dr Unit Las
- 1619 La Cumbre Ln
- 250 N Las Flores Dr
- 202 N Las Flores Dr Unit LAS
- 202 N Las Flores Dr
- 220 Pablo Ln
- 261 N Las Flores Dr
- 148 N Las Flores Dr
- 240 Pablo Ln
- 260 N Las Flores Dr
- 1625 La Cumbre Ln
- 161 N Las Flores Dr Unit Las
- 161 N Las Flores Dr
- 260 Pablo Ln
- 136 N Las Flores Dr
- 290 N Las Flores Dr
- 210 N Las Flores Dr
Your Personal Tour Guide
Ask me questions while you tour the home.