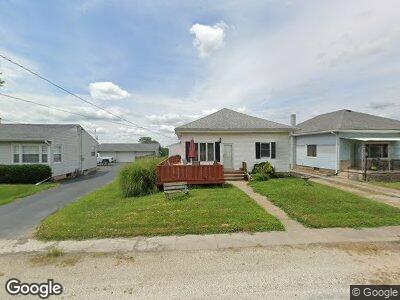
225 N Stanton St Bluffs, IL 62621
Estimated Value: $69,000 - $84,561
3
Beds
1
Bath
1,500
Sq Ft
$52/Sq Ft
Est. Value
About This Home
This home is located at 225 N Stanton St, Bluffs, IL 62621 and is currently estimated at $78,520, approximately $52 per square foot. 225 N Stanton St is a home located in Scott County with nearby schools including Bluffs Elementary School.
Ownership History
Date
Name
Owned For
Owner Type
Purchase Details
Closed on
Mar 15, 2001
Bought by
Evans James C and Evans Colleen L
Current Estimated Value
Create a Home Valuation Report for This Property
The Home Valuation Report is an in-depth analysis detailing your home's value as well as a comparison with similar homes in the area
Home Values in the Area
Average Home Value in this Area
Purchase History
| Date | Buyer | Sale Price | Title Company |
|---|---|---|---|
| Evans James C | -- | -- |
Source: Public Records
Tax History Compared to Growth
Tax History
| Year | Tax Paid | Tax Assessment Tax Assessment Total Assessment is a certain percentage of the fair market value that is determined by local assessors to be the total taxable value of land and additions on the property. | Land | Improvement |
|---|---|---|---|---|
| 2024 | $1,285 | $22,558 | $2,939 | $19,619 |
| 2023 | $1,285 | $20,719 | $2,700 | $18,019 |
| 2022 | $1,125 | $19,997 | $2,606 | $17,391 |
| 2021 | $1,233 | $20,720 | $2,486 | $18,234 |
| 2020 | $1,229 | $21,031 | $2,523 | $18,508 |
| 2019 | $1,320 | $21,151 | $2,537 | $18,614 |
| 2018 | $1,336 | $20,954 | $2,513 | $18,441 |
| 2017 | $1,169 | $20,100 | $2,411 | $17,689 |
| 2016 | $998 | $17,947 | $2,153 | $15,794 |
| 2015 | $949 | $17,412 | $2,089 | $15,323 |
| 2013 | $962 | $17,619 | $2,114 | $15,505 |
Source: Public Records
Map
Nearby Homes