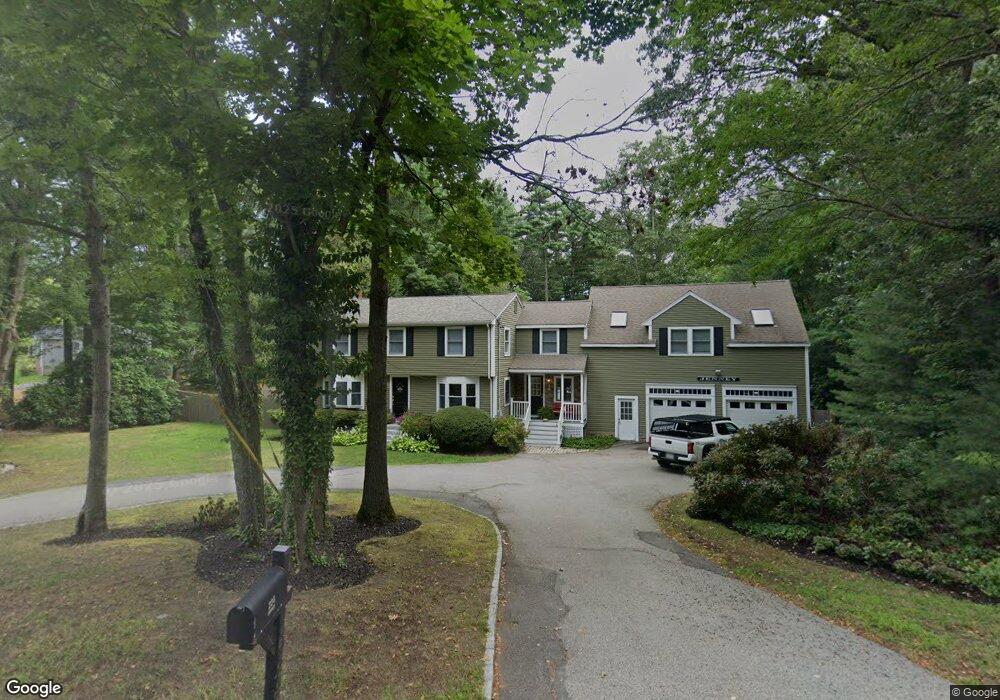
225 Oldham St Pembroke, MA 02359
Estimated Value: $699,000 - $793,000
4
Beds
2
Baths
1,856
Sq Ft
$404/Sq Ft
Est. Value
About This Home
This home is located at 225 Oldham St, Pembroke, MA 02359 and is currently estimated at $748,977, approximately $403 per square foot. 225 Oldham St is a home located in Plymouth County with nearby schools including Pembroke High School and Cardinal Cushing Centers.
Ownership History
Date
Name
Owned For
Owner Type
Purchase Details
Closed on
Sep 30, 2008
Sold by
Gale Martha R
Bought by
Jenney Jason D and Jenney Elisabeth T
Current Estimated Value
Home Financials for this Owner
Home Financials are based on the most recent Mortgage that was taken out on this home.
Original Mortgage
$201,465
Interest Rate
6.57%
Mortgage Type
Purchase Money Mortgage
Purchase Details
Closed on
May 28, 1993
Sold by
Pedretti Stephen J and Pedretti Darlene M
Bought by
Gale Frederick E and Gale Martha R
Create a Home Valuation Report for This Property
The Home Valuation Report is an in-depth analysis detailing your home's value as well as a comparison with similar homes in the area
Home Values in the Area
Average Home Value in this Area
Purchase History
| Date | Buyer | Sale Price | Title Company |
|---|---|---|---|
| Jenney Jason D | $328,000 | -- | |
| Gale Frederick E | $150,000 | -- |
Source: Public Records
Mortgage History
| Date | Status | Borrower | Loan Amount |
|---|---|---|---|
| Open | Gale Frederick E | $204,486 | |
| Closed | Gale Frederick E | $201,465 | |
| Previous Owner | Gale Frederick E | $40,000 |
Source: Public Records
Tax History Compared to Growth
Tax History
| Year | Tax Paid | Tax Assessment Tax Assessment Total Assessment is a certain percentage of the fair market value that is determined by local assessors to be the total taxable value of land and additions on the property. | Land | Improvement |
|---|---|---|---|---|
| 2025 | $7,981 | $664,000 | $315,900 | $348,100 |
| 2024 | $7,882 | $655,200 | $310,700 | $344,500 |
| 2023 | $7,448 | $585,500 | $285,900 | $299,600 |
| 2022 | $7,139 | $504,500 | $238,100 | $266,400 |
| 2021 | $7,014 | $481,100 | $228,100 | $253,000 |
| 2020 | $6,836 | $471,800 | $223,300 | $248,500 |
| 2019 | $6,544 | $448,200 | $212,600 | $235,600 |
| 2018 | $6,380 | $428,500 | $207,400 | $221,100 |
| 2017 | $6,294 | $416,800 | $197,400 | $219,400 |
| 2016 | $6,118 | $400,900 | $185,000 | $215,900 |
| 2015 | $5,467 | $370,900 | $177,400 | $193,500 |
Source: Public Records
Map
Nearby Homes
- 18 Wampatuck St
- 10 Warren Terrace
- 8 Pinehurst Ave
- 22 Pondview Ave
- 53 Grove St
- 269 Lakeside Rd
- 29 Liberty Dr Unit 29
- 204 Center St Unit 9
- 299 Center St
- 456 Maquan St
- 134 Crescent St
- 285 W Elm St
- 7 Farmside Dr
- 456 Gorwin Dr
- 15 Elm Place
- 10 Fir Rd
- 78 Old Cart Path Ln Unit Lot 3
- 5 Hatch Rd
- 72 Old Cart Path Ln Unit Lot 2
- 77 Old Cart Path Ln Unit Lot 4