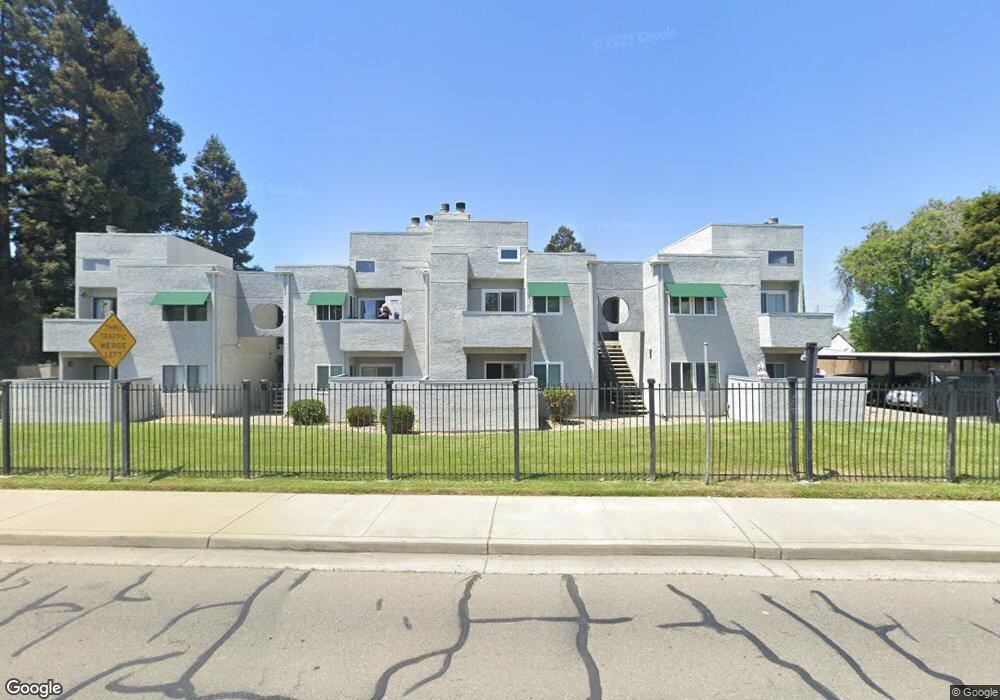
225 Pennsylvania Ave Unit E4 Fairfield, CA 94533
Estimated Value: $288,000 - $314,000
2
Beds
2
Baths
930
Sq Ft
$322/Sq Ft
Est. Value
About This Home
This home is located at 225 Pennsylvania Ave Unit E4, Fairfield, CA 94533 and is currently estimated at $299,710, approximately $322 per square foot. 225 Pennsylvania Ave Unit E4 is a home located in Solano County with nearby schools including Crystal Middle School, Armijo High School, and We R Family Christian School.
Ownership History
Date
Name
Owned For
Owner Type
Purchase Details
Closed on
May 24, 2019
Sold by
Townsend Ken and Townsend Susie
Bought by
The Ken And Susie Townsend Living Trust
Current Estimated Value
Purchase Details
Closed on
Oct 21, 2011
Sold by
Ugochukwu Ama J and Ugochukwu Chinwe O
Bought by
Townsend Ken and Townsend Susie
Purchase Details
Closed on
Oct 24, 2005
Sold by
Paulson Kimberly
Bought by
Ugochukwu Ama J and Ugochukwu Chinwe O
Home Financials for this Owner
Home Financials are based on the most recent Mortgage that was taken out on this home.
Original Mortgage
$233,750
Interest Rate
6.87%
Mortgage Type
New Conventional
Purchase Details
Closed on
May 5, 2004
Sold by
Sharon Creek Condominiums North Llc
Bought by
Paulson Kimberly
Home Financials for this Owner
Home Financials are based on the most recent Mortgage that was taken out on this home.
Original Mortgage
$174,800
Interest Rate
4.62%
Mortgage Type
Purchase Money Mortgage
Create a Home Valuation Report for This Property
The Home Valuation Report is an in-depth analysis detailing your home's value as well as a comparison with similar homes in the area
Home Values in the Area
Average Home Value in this Area
Purchase History
| Date | Buyer | Sale Price | Title Company |
|---|---|---|---|
| The Ken And Susie Townsend Living Trust | -- | None Available | |
| Townsend Ken | $42,500 | Old Republic Title Company | |
| Ugochukwu Ama J | $275,000 | Chicago Title Co | |
| Paulson Kimberly | $184,000 | First American Title Co |
Source: Public Records
Mortgage History
| Date | Status | Borrower | Loan Amount |
|---|---|---|---|
| Previous Owner | Ugochukwu Ama J | $233,750 | |
| Previous Owner | Paulson Kimberly | $174,800 |
Source: Public Records
Tax History
| Year | Tax Paid | Tax Assessment Tax Assessment Total Assessment is a certain percentage of the fair market value that is determined by local assessors to be the total taxable value of land and additions on the property. | Land | Improvement |
|---|---|---|---|---|
| 2025 | $619 | $52,867 | $12,555 | $40,312 |
| 2024 | $619 | $51,831 | $12,309 | $39,522 |
| 2023 | $601 | $50,816 | $12,068 | $38,748 |
| 2022 | $594 | $49,821 | $11,832 | $37,989 |
| 2021 | $588 | $48,845 | $11,600 | $37,245 |
| 2020 | $575 | $48,346 | $11,482 | $36,864 |
| 2019 | $562 | $47,399 | $11,257 | $36,142 |
| 2018 | $579 | $46,471 | $11,037 | $35,434 |
| 2017 | $554 | $45,561 | $10,821 | $34,740 |
| 2016 | $539 | $44,668 | $10,609 | $34,059 |
| 2015 | $505 | $43,998 | $10,450 | $33,548 |
| 2014 | $500 | $43,137 | $10,246 | $32,891 |
Source: Public Records
Map
Nearby Homes
- 225 Pennsylvania Ave Unit E7
- 0 Illinois St Unit 326015469
- 1443 Woolner Ave
- 0 Madison St
- 735 Ohio St
- 1308 Empire St
- 1316 Empire St
- 423 Gregory Ln Unit 28L
- 423 Gregory Ln Unit 30
- 724 Delaware St
- 1417 Hawaii St
- 200 Solano St
- 201 Sacramento St
- 615 Main St
- 122 Flounder St
- 1024 Tyler St
- TBD Tract 8 Fcr 445
- 0 Webster St Unit 41120649
- 1042 Hayes St
- 8 Deck Dr
- 225 Pennsylvania Ave Unit E1
- 225 Pennsylvania Ave Unit D4
- 225 Pennsylvania Ave Unit D2
- 225 Pennsylvania Ave
- 225 Pennsylvania Ave Unit D6
- 225 Pennsylvania Ave Unit D8
- 225 Pennsylvania Ave Unit E8
- 225 Pennsylvania Ave Unit E6
- 225 Pennsylvania Ave Unit E2
- 225 Pennsylvania Ave Unit C6
- 225 Pennsylvania Ave Unit C4
- 225 Pennsylvania Ave Unit C2
- 225 Pennsylvania Ave Unit B6
- 225 Pennsylvania Ave Unit B4
- 225 Pennsylvania Ave Unit B2
- 225 Pennsylvania Ave Unit A2
- 225 Pennsylvania Ave Unit A4
- 225 Pennsylvania Ave Unit A6
- 225 Pennsylvania Ave Unit A8
Your Personal Tour Guide
Ask me questions while you tour the home.