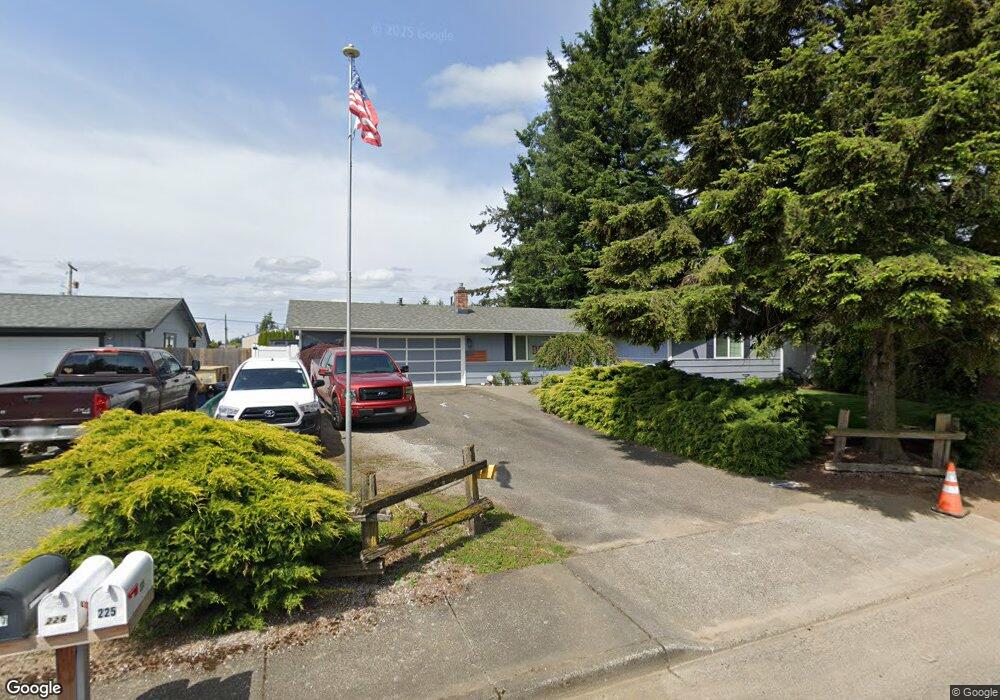
225 Pollman Cir Lynden, WA 98264
Estimated Value: $447,000 - $561,000
4
Beds
2
Baths
1,303
Sq Ft
$378/Sq Ft
Est. Value
About This Home
This home is located at 225 Pollman Cir, Lynden, WA 98264 and is currently estimated at $492,585, approximately $378 per square foot. 225 Pollman Cir is a home located in Whatcom County with nearby schools including Irene Reither Elementary School, Meridian Middle School, and Meridian High School.
Ownership History
Date
Name
Owned For
Owner Type
Purchase Details
Closed on
Jul 19, 2018
Sold by
Hartley Richard E and Hartley Virginia
Bought by
Johnson Teri L and Johnson Darrol E
Current Estimated Value
Home Financials for this Owner
Home Financials are based on the most recent Mortgage that was taken out on this home.
Original Mortgage
$153,200
Outstanding Balance
$132,235
Interest Rate
4.6%
Mortgage Type
VA
Estimated Equity
$360,350
Purchase Details
Closed on
Jun 20, 2001
Sold by
Malella James Francis and Malella Nancy Lee
Bought by
Hartley Richard E and Hartley Virginia
Home Financials for this Owner
Home Financials are based on the most recent Mortgage that was taken out on this home.
Original Mortgage
$118,607
Interest Rate
7.15%
Create a Home Valuation Report for This Property
The Home Valuation Report is an in-depth analysis detailing your home's value as well as a comparison with similar homes in the area
Purchase History
| Date | Buyer | Sale Price | Title Company |
|---|---|---|---|
| Johnson Teri L | $150,000 | Chicago Title Insurance | |
| Hartley Richard E | $124,850 | Chicago Title Insurance |
Source: Public Records
Mortgage History
| Date | Status | Borrower | Loan Amount |
|---|---|---|---|
| Open | Johnson Teri L | $153,200 | |
| Previous Owner | Hartley Richard E | $118,607 |
Source: Public Records
Tax History
| Year | Tax Paid | Tax Assessment Tax Assessment Total Assessment is a certain percentage of the fair market value that is determined by local assessors to be the total taxable value of land and additions on the property. | Land | Improvement |
|---|---|---|---|---|
| 2025 | $3,710 | $433,515 | $231,345 | $202,170 |
| 2024 | $3,269 | $420,420 | $218,250 | $202,170 |
| 2023 | $3,269 | $419,394 | $225,000 | $194,394 |
| 2022 | $2,957 | $355,628 | $162,045 | $193,583 |
| 2021 | $2,888 | $293,904 | $133,920 | $159,984 |
| 2020 | $2,582 | $262,420 | $119,574 | $142,846 |
| 2019 | $2,262 | $235,261 | $107,199 | $128,062 |
| 2018 | $2,605 | $225,386 | $102,699 | $122,687 |
| 2017 | $2,401 | $197,516 | $90,000 | $107,516 |
| 2016 | $2,199 | $192,710 | $78,325 | $114,385 |
| 2015 | $2,118 | $175,605 | $72,475 | $103,130 |
| 2014 | -- | $163,999 | $67,275 | $96,724 |
| 2013 | -- | $156,508 | $65,000 | $91,508 |
Source: Public Records
Map
Nearby Homes
- 0 Old Guide Rd
- 693 Shultz Dr
- 361 W Wiser Lake Rd
- 380 E Pole Rd Unit 13
- 7349 Old Guide Rd
- 6743 La Bello Dr
- 6786 La Bello Dr
- 6037 Old Guide Rd
- 6917 Red Ridge Dr
- 490 W Laurel Rd
- 6849 Raspberry Dr
- 765 van Dyk Rd
- 7343 Hannegan Rd Unit 2
- 7393 Hannegan Rd
- 5984 Longdin Rd
- 151 Bay Lyn Dr
- 351 W Silverado Ct
- 353 E Silverado Ct
- 411 E Axton Rd
- 1420 Birch Bay Lynden Rd
- 223 Pollman Cir
- 221 Pollman Cir
- 229 Pollman Cir
- 224 Pollman Cir
- 6839 Old Guide Rd
- 226 Pollman Cir
- 222 Pollman Cir
- 228 Pollman Cir
- 219 Pollman Cir
- 6839 Dutch Haven Dr
- 218 Pollman Cir
- 6847 Dutch Haven Dr
- 230 Pollman Cir
- 6835 Dutch Haven Dr
- 231 Pollman Cir
- 217 Pollman Cir
- 6851 Dutch Haven Dr
- 6831 Dutch Haven Dr
- 6863 Old Guide Rd
Your Personal Tour Guide
Ask me questions while you tour the home.