225 Poplar St Syracuse, NE 68446
Estimated Value: $156,000 - $181,000
3
Beds
2
Baths
1,212
Sq Ft
$139/Sq Ft
Est. Value
About This Home
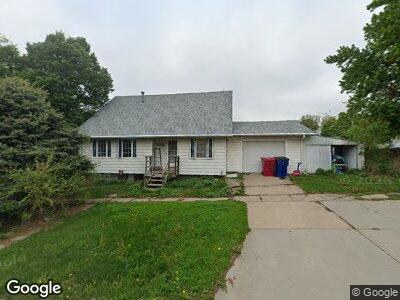
This home is located at 225 Poplar St, Syracuse, NE 68446 and is currently estimated at $168,140, approximately $138 per square foot. 225 Poplar St is a home located in Otoe County with nearby schools including Elementary School at Syracuse and High School at Syracuse.
Ownership History
Date
Name
Owned For
Owner Type
Purchase Details
Closed on
Mar 2, 2015
Sold by
Beach Ryan E and Beach Ashley L
Bought by
Backer Kati Jo and Robinson Cody M
Current Estimated Value
Home Financials for this Owner
Home Financials are based on the most recent Mortgage that was taken out on this home.
Original Mortgage
$91,326
Interest Rate
3.66%
Mortgage Type
New Conventional
Create a Home Valuation Report for This Property
The Home Valuation Report is an in-depth analysis detailing your home's value as well as a comparison with similar homes in the area
Home Values in the Area
Average Home Value in this Area
Purchase History
| Date | Buyer | Sale Price | Title Company |
|---|---|---|---|
| Backer Kati Jo | $89,777 | Nebraska Title Company |
Source: Public Records
Mortgage History
| Date | Status | Borrower | Loan Amount |
|---|---|---|---|
| Closed | Backer Kati Jo | $91,326 | |
| Closed | Beach Ryan E | $102,800 | |
| Closed | Beach Ryan E | $105,000 | |
| Closed | Beach Ryan E | $80,000 |
Source: Public Records
Tax History Compared to Growth
Tax History
| Year | Tax Paid | Tax Assessment Tax Assessment Total Assessment is a certain percentage of the fair market value that is determined by local assessors to be the total taxable value of land and additions on the property. | Land | Improvement |
|---|---|---|---|---|
| 2024 | $1,765 | $103,080 | $5,530 | $97,550 |
| 2023 | $1,990 | $103,080 | $5,530 | $97,550 |
| 2022 | $1,604 | $83,570 | $5,530 | $78,040 |
| 2021 | $1,569 | $83,570 | $5,530 | $78,040 |
| 2020 | $1,592 | $83,570 | $5,530 | $78,040 |
| 2019 | $1,609 | $83,570 | $5,530 | $78,040 |
| 2018 | $1,538 | $83,570 | $5,530 | $78,040 |
| 2017 | $1,202 | $67,030 | $3,590 | $63,440 |
| 2016 | $1,201 | $67,030 | $3,590 | $63,440 |
| 2015 | $1,183 | $65,560 | $2,120 | $63,440 |
| 2014 | $1,128 | $58,870 | $2,120 | $56,750 |
| 2012 | $1,144 | $58,870 | $2,120 | $56,750 |
Source: Public Records
Map
Nearby Homes