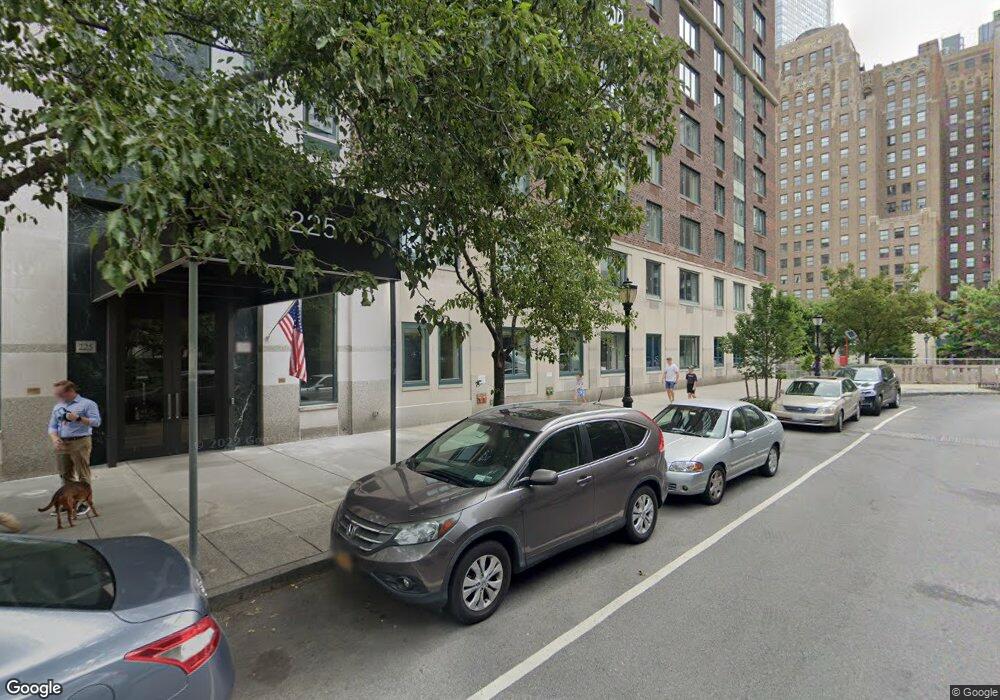
225 Rector Place, Unit 7K Floor 7 New York, NY 10280
Battery Park NeighborhoodEstimated payment $529,254/month
Total Views
2,948
2
Beds
2
Baths
696
Sq Ft
$143,678
Price per Sq Ft
Highlights
- Popular Property
- 4-minute walk to Rector Street (1 Line)
- Garage
- Battery Park City School Rated A
- Elevator
- 2-minute walk to West Thames Park
About This Home
This is a test
Property Details
Home Type
- Condo-Op
Year Built
- Built in 1985
HOA Fees
- $2,200 Monthly HOA Fees
Parking
- Garage
Home Design
- 696 Sq Ft Home
Bedrooms and Bathrooms
- 2 Bedrooms
- 2 Full Bathrooms
Laundry
- Laundry in unit
Listing and Financial Details
- Tax Block 16
Community Details
Overview
- High-Rise Condominium
- Battery Park City Subdivision
- 23-Story Property
Amenities
- Elevator
Map
About This Building
Create a Home Valuation Report for This Property
The Home Valuation Report is an in-depth analysis detailing your home's value as well as a comparison with similar homes in the area
Home Values in the Area
Average Home Value in this Area
Tax History
| Year | Tax Paid | Tax Assessment Tax Assessment Total Assessment is a certain percentage of the fair market value that is determined by local assessors to be the total taxable value of land and additions on the property. | Land | Improvement |
|---|---|---|---|---|
| 2025 | -- | $126,319 | $17,326 | $108,993 |
| 2024 | -- | $122,808 | $17,326 | $105,482 |
| 2023 | $0 | $116,169 | $17,326 | $98,843 |
| 2022 | $1 | $106,916 | $17,326 | $89,590 |
| 2021 | $0 | $106,916 | $17,326 | $89,590 |
| 2020 | $0 | $118,369 | $17,326 | $101,043 |
| 2019 | $0 | $115,707 | $17,326 | $98,381 |
| 2018 | $0 | $111,664 | $17,326 | $94,338 |
| 2017 | $0 | $131,215 | $17,326 | $113,889 |
| 2016 | $0 | $122,818 | $17,327 | $105,491 |
| 2015 | -- | $120,285 | $17,326 | $102,959 |
| 2014 | -- | $107,029 | $17,326 | $89,703 |
Source: Public Records
Property History
| Date | Event | Price | List to Sale | Price per Sq Ft |
|---|---|---|---|---|
| 11/06/2025 11/06/25 | For Sale | $99,999,999 | 0.0% | $143,678 / Sq Ft |
| 04/22/2022 04/22/22 | Rented | $4,295 | 0.0% | -- |
| 03/21/2022 03/21/22 | For Rent | $4,295 | +22.9% | -- |
| 04/28/2014 04/28/14 | Rented | -- | -- | -- |
| 03/29/2014 03/29/14 | Under Contract | -- | -- | -- |
| 12/28/2013 12/28/13 | For Rent | $3,495 | -- | -- |
Source: Real Estate Board of New York (REBNY)
Purchase History
| Date | Type | Sale Price | Title Company |
|---|---|---|---|
| Deed | $702,593 | -- |
Source: Public Records
Mortgage History
| Date | Status | Loan Amount | Loan Type |
|---|---|---|---|
| Open | $350,000 | No Value Available |
Source: Public Records
Source: Real Estate Board of New York (REBNY)
MLS Number: RLS20058573
APN: 0016-3298
Disclaimer: Certain information contained herein is derived from information provided by parties other than Homes.com. All information provided is deemed reliable, but is not guaranteed to be accurate and should be independently verified.
![]() This information is not verified for authenticity or accuracy and is not guaranteed and may not reflect all real estate activity in the market. ©2025 The Real Estate Board of New York, Inc., All rights reserved.
This information is not verified for authenticity or accuracy and is not guaranteed and may not reflect all real estate activity in the market. ©2025 The Real Estate Board of New York, Inc., All rights reserved.
RLS Data display by Homes.com LLC
Nearby Homes
- 225 Rector Place Unit 2-DD
- 225 Rector Place Unit 5K
- 225 Rector Place Unit 12R
- 225 Rector Place Unit 22A
- 225 Rector Place Unit 12F
- 250 S End Ave Unit 5D
- 250 S End Ave Unit PH2B
- 250 S End Ave Unit 3F
- 300 Albany St Unit 6G
- 300 Albany St Unit 7I
- 300 Albany St Unit 4K
- 300 Albany St Unit 4A
- 200 Rector Place Unit 12H
- 200 Rector Place Unit 36LM
- 200 Rector Place Unit 6E
- 200 Rector Place Unit 31B
- 200 Rector Place Unit 7V
- 200 Rector Place Unit 10F
- 200 Rector Place Unit 43D
- 200 Rector Place Unit 31F
- 225 Rector Place Unit 14J
- 225 Rector Place Unit 8-32
- 225 Rector Place Unit ID1268027P
- 225 Rector Place Unit ID1268028P
- 200 Rector Place Unit 304
- 200 Rector Place Unit 19H
- 350 Albany St Unit 7-F
- 350 Albany St Unit 3Q
- 50 West St Unit 45-B
- 350 Albany St Unit 4L
- 280 Rector Place Unit 3H
- 123 Washington St Unit 37H
- 123 Washington St Unit FL27-ID1356
- 123 Washington St Unit FL29-ID1378
- 123 Washington St Unit FL27-ID1357
- 123 Washington St Unit FL29-ID1371
- 340 Albany St Unit TH
- 33 Rector St Unit 19 D
- 99 Battery Place Unit 19F
- 99 Washington St
