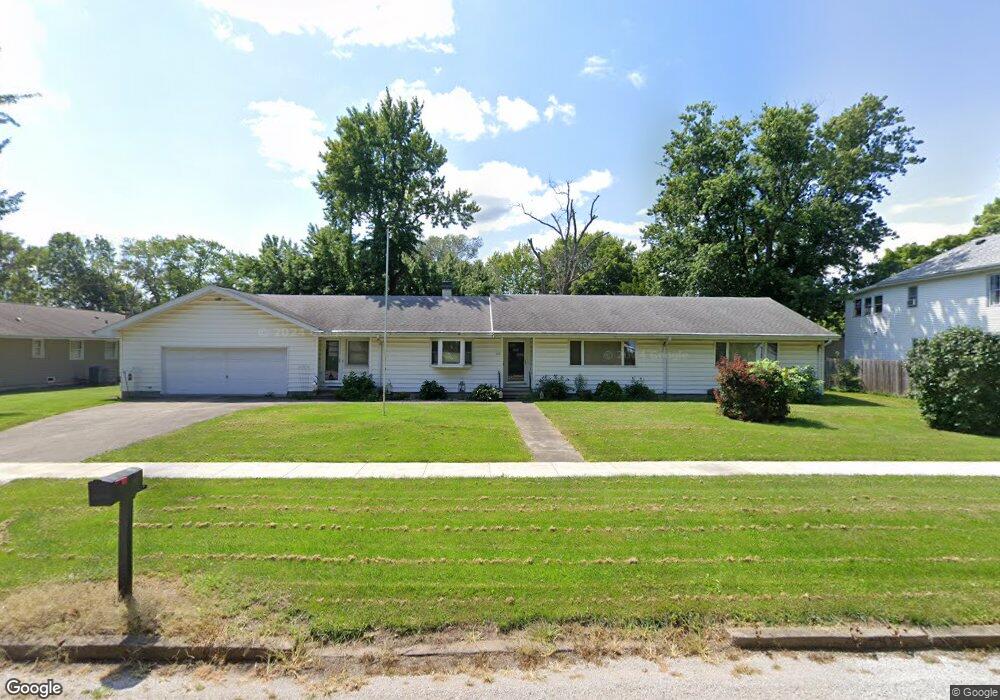
225 S High St Lovington, IL 61937
Estimated Value: $139,000 - $165,000
3
Beds
3
Baths
2,259
Sq Ft
$67/Sq Ft
Est. Value
About This Home
This home is located at 225 S High St, Lovington, IL 61937 and is currently estimated at $151,796, approximately $67 per square foot. 225 S High St is a home located in Moultrie County with nearby schools including Lovington Grade School and Arthur Lovington Atwood Hammond High School.
Ownership History
Date
Name
Owned For
Owner Type
Purchase Details
Closed on
Oct 1, 2010
Sold by
Taylor Darrel L and Taylor Donna Lea
Bought by
Voss Jane W
Current Estimated Value
Home Financials for this Owner
Home Financials are based on the most recent Mortgage that was taken out on this home.
Original Mortgage
$75,600
Interest Rate
4.27%
Mortgage Type
New Conventional
Purchase Details
Closed on
May 24, 2010
Sold by
Cockrum Raymond M and Cockrum Virginia L
Bought by
Taylor Darrel L and Taylor Donna Lea
Purchase Details
Closed on
Aug 16, 2006
Sold by
Cockrum Raymond M and Cockrum Virgina L
Bought by
Taylor Donna Lea and Cockrum Marion Gale
Purchase Details
Closed on
May 3, 2006
Sold by
Bowers Steven G
Bought by
Cockrum Raymond and Cockrum Virginia L
Home Financials for this Owner
Home Financials are based on the most recent Mortgage that was taken out on this home.
Original Mortgage
$73,600
Interest Rate
7.37%
Mortgage Type
Adjustable Rate Mortgage/ARM
Create a Home Valuation Report for This Property
The Home Valuation Report is an in-depth analysis detailing your home's value as well as a comparison with similar homes in the area
Home Values in the Area
Average Home Value in this Area
Purchase History
| Date | Buyer | Sale Price | Title Company |
|---|---|---|---|
| Voss Jane W | $94,500 | None Available | |
| Taylor Darrel L | $66,000 | None Available | |
| Taylor Donna Lea | -- | None Available | |
| Cockrum Raymond | $92,000 | None Available |
Source: Public Records
Mortgage History
| Date | Status | Borrower | Loan Amount |
|---|---|---|---|
| Previous Owner | Voss Jane W | $75,600 | |
| Previous Owner | Cockrum Raymond | $73,600 |
Source: Public Records
Tax History Compared to Growth
Tax History
| Year | Tax Paid | Tax Assessment Tax Assessment Total Assessment is a certain percentage of the fair market value that is determined by local assessors to be the total taxable value of land and additions on the property. | Land | Improvement |
|---|---|---|---|---|
| 2024 | $1,659 | $33,770 | $3,336 | $30,434 |
| 2023 | $1,449 | $31,706 | $3,132 | $28,574 |
| 2022 | $1,416 | $31,887 | $4,844 | $27,043 |
| 2021 | $1,934 | $30,316 | $4,605 | $25,711 |
| 2020 | $1,891 | $29,111 | $4,422 | $24,689 |
| 2019 | $1,842 | $28,599 | $4,344 | $24,255 |
| 2018 | $1,956 | $30,178 | $3,085 | $27,093 |
| 2017 | $1,954 | $30,061 | $3,073 | $26,988 |
| 2016 | $1,999 | $30,128 | $3,080 | $27,048 |
| 2015 | $1,965 | $29,540 | $3,020 | $26,520 |
| 2014 | -- | $29,510 | $3,060 | $26,450 |
| 2013 | -- | $29,510 | $3,060 | $26,450 |
Source: Public Records
Map
Nearby Homes
- 226 S Noah St
- 426 W Springfield Rd
- 14 E Okaw Estates
- 670 County Rd 1875 N
- 507 S C St
- 453 Cr 1750n
- 746 Cr 1500n
- 114 E North St
- 11 Iola Ct
- 818 N Market St
- 207 N Washington St
- 235 E 150 Rd N
- 204 N East B St
- 312 W North Water St
- 525 N Main St
- 509 N Seymour St
- 320 S Saint John St
- 215 W Mitchell St
- 415 W Blackwood St
- 410 N Madison St