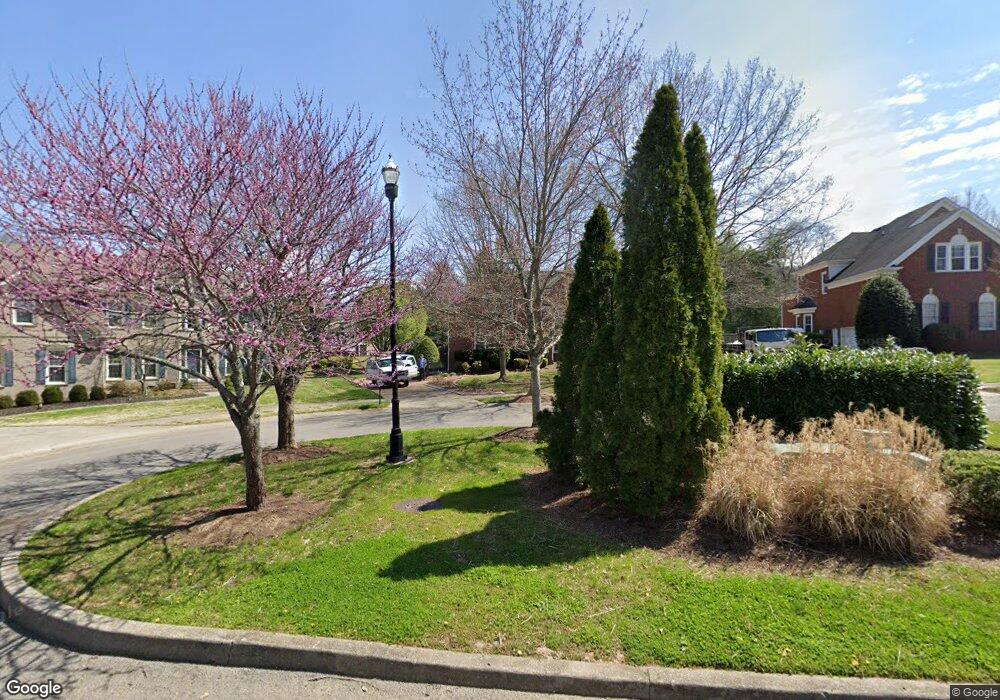
225 Scurlock Ct Franklin, TN 37067
McEwen NeighborhoodEstimated Value: $1,197,050 - $1,328,000
--
Bed
4
Baths
3,399
Sq Ft
$373/Sq Ft
Est. Value
About This Home
This home is located at 225 Scurlock Ct, Franklin, TN 37067 and is currently estimated at $1,267,013, approximately $372 per square foot. 225 Scurlock Ct is a home located in Williamson County with nearby schools including Kenrose Elementary School, Woodland Middle School, and Ravenwood High School.
Ownership History
Date
Name
Owned For
Owner Type
Purchase Details
Closed on
Jun 14, 2013
Sold by
Cobb Janice
Bought by
Cobb Janice and Bullock Robert L
Current Estimated Value
Home Financials for this Owner
Home Financials are based on the most recent Mortgage that was taken out on this home.
Original Mortgage
$290,500
Outstanding Balance
$196,549
Interest Rate
2.5%
Mortgage Type
Adjustable Rate Mortgage/ARM
Estimated Equity
$1,070,464
Purchase Details
Closed on
Jun 9, 2003
Sold by
Lee Kyu Koon and Lee Hyun Mee
Bought by
Vaneron George J and Vaneron Valli
Home Financials for this Owner
Home Financials are based on the most recent Mortgage that was taken out on this home.
Original Mortgage
$175,000
Interest Rate
5.68%
Mortgage Type
Purchase Money Mortgage
Purchase Details
Closed on
Aug 4, 1997
Sold by
Jones Land Co Llc
Bought by
Kyu Lee Koon and Mee Hyun
Purchase Details
Closed on
Jan 6, 1997
Sold by
Jones Land Co Llc
Bought by
Jones Co Custom Homes Of T
Create a Home Valuation Report for This Property
The Home Valuation Report is an in-depth analysis detailing your home's value as well as a comparison with similar homes in the area
Home Values in the Area
Average Home Value in this Area
Purchase History
| Date | Buyer | Sale Price | Title Company |
|---|---|---|---|
| Cobb Janice | -- | None Available | |
| Cobb Janice | $528,500 | None Available | |
| Vaneron George J | $382,500 | Nations Title Agency Tn Inc | |
| Kyu Lee Koon | $322,981 | -- | |
| Jones Co Custom Homes Of T | $385,000 | -- |
Source: Public Records
Mortgage History
| Date | Status | Borrower | Loan Amount |
|---|---|---|---|
| Open | Cobb Janice | $290,500 | |
| Previous Owner | Vaneron George J | $175,000 |
Source: Public Records
Tax History Compared to Growth
Tax History
| Year | Tax Paid | Tax Assessment Tax Assessment Total Assessment is a certain percentage of the fair market value that is determined by local assessors to be the total taxable value of land and additions on the property. | Land | Improvement |
|---|---|---|---|---|
| 2025 | -- | $263,000 | $82,500 | $180,500 |
| 2024 | -- | $167,050 | $40,000 | $127,050 |
| 2023 | $0 | $164,350 | $40,000 | $124,350 |
| 2022 | $3,544 | $164,350 | $40,000 | $124,350 |
| 2021 | $3,544 | $164,350 | $40,000 | $124,350 |
| 2020 | $3,592 | $139,350 | $28,750 | $110,600 |
| 2019 | $3,592 | $139,350 | $28,750 | $110,600 |
| 2018 | $3,494 | $139,350 | $28,750 | $110,600 |
| 2017 | $3,467 | $139,350 | $28,750 | $110,600 |
| 2016 | $3,425 | $139,350 | $28,750 | $110,600 |
| 2015 | -- | $111,325 | $23,750 | $87,575 |
| 2014 | -- | $111,325 | $23,750 | $87,575 |
Source: Public Records
Map
Nearby Homes
- 300 Matherson Ct
- 108 Broadwell Cir
- 609 Amberleigh Ct
- 446 Savannah Way
- 154 Rue de Grande
- 8126 Suzanne Dr
- 111 Walters Ave
- 216 Bateman Ave
- 0 Moores Ln
- 8115 Vaden Dr
- 1529 Sam Houston Dr
- 8122 Boiling Springs Place
- 8103 Turning Point Dr
- 8124 Boiling Springs Place
- 8230 Frontier Ln
- 1556 White Barn Way
- RUTLEDGE Plan at Primm Farm
- Plan 25851 at Primm Farm
- MARABELLE Plan at Primm Farm
- 8107 Turning Point Dr