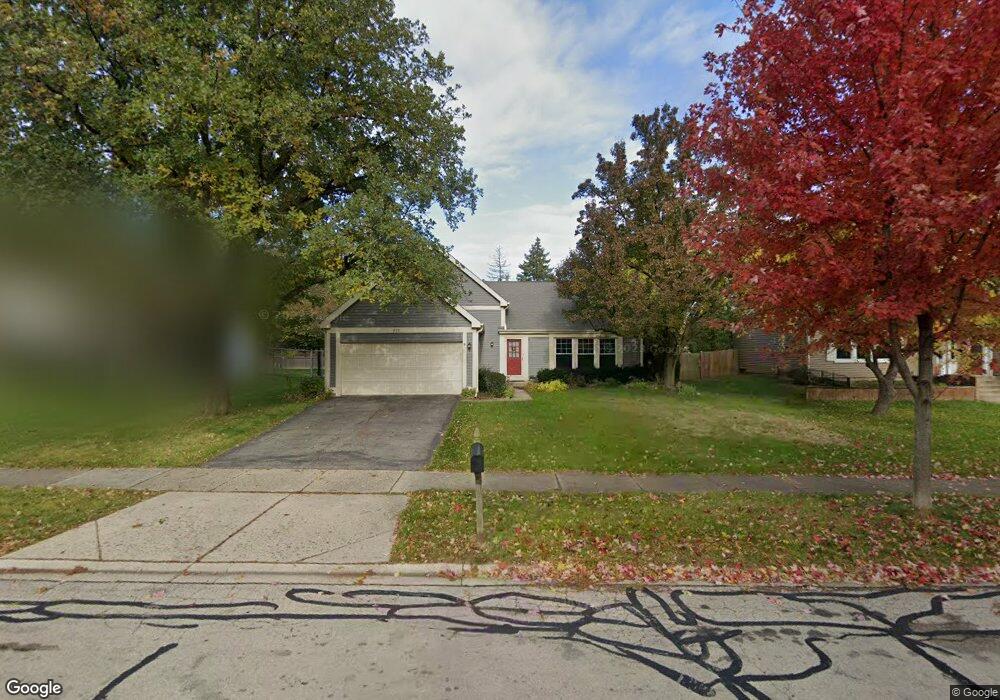
225 Split Oak Rd Naperville, IL 60565
Old Farm NeighborhoodEstimated Value: $395,000 - $477,000
4
Beds
2
Baths
1,200
Sq Ft
$370/Sq Ft
Est. Value
About This Home
This home is located at 225 Split Oak Rd, Naperville, IL 60565 and is currently estimated at $444,583, approximately $370 per square foot. 225 Split Oak Rd is a home located in DuPage County with nearby schools including Kingsley Elementary School, Lincoln Jr. High School, and Naperville Central High School.
Ownership History
Date
Name
Owned For
Owner Type
Purchase Details
Closed on
Jan 27, 2017
Sold by
Goon Don and Goon Diana
Bought by
Goon Nathaniel W and Goon Gloria Y
Current Estimated Value
Purchase Details
Closed on
Feb 20, 2008
Sold by
Prochaska Roy J and Prochaska Jennifer L
Bought by
Goon Don and Goon Diana
Purchase Details
Closed on
Apr 30, 1997
Sold by
Wiemeler Henry E and Wiemeler Patricia A
Bought by
Prochaska Roy J and Pietrini Jennifer L
Home Financials for this Owner
Home Financials are based on the most recent Mortgage that was taken out on this home.
Original Mortgage
$125,200
Interest Rate
8.05%
Purchase Details
Closed on
Aug 31, 1994
Sold by
Zawacki Kenneth D and Zawacki Roberta Carey
Bought by
Wiemeler Henry E and Wiemeler Patricia A
Home Financials for this Owner
Home Financials are based on the most recent Mortgage that was taken out on this home.
Original Mortgage
$13,000
Interest Rate
8.65%
Create a Home Valuation Report for This Property
The Home Valuation Report is an in-depth analysis detailing your home's value as well as a comparison with similar homes in the area
Home Values in the Area
Average Home Value in this Area
Purchase History
| Date | Buyer | Sale Price | Title Company |
|---|---|---|---|
| Goon Nathaniel W | $200,000 | Chicago Title Insurance Co | |
| Goon Don | $250,000 | Pntn | |
| Prochaska Roy J | $156,500 | Law Title | |
| Wiemeler Henry E | $148,500 | -- |
Source: Public Records
Mortgage History
| Date | Status | Borrower | Loan Amount |
|---|---|---|---|
| Previous Owner | Prochaska Roy J | $125,200 | |
| Previous Owner | Wiemeler Henry E | $13,000 |
Source: Public Records
Tax History Compared to Growth
Tax History
| Year | Tax Paid | Tax Assessment Tax Assessment Total Assessment is a certain percentage of the fair market value that is determined by local assessors to be the total taxable value of land and additions on the property. | Land | Improvement |
|---|---|---|---|---|
| 2024 | $7,322 | $127,529 | $65,852 | $61,677 |
| 2023 | $7,043 | $116,390 | $60,100 | $56,290 |
| 2022 | $6,460 | $105,810 | $54,640 | $51,170 |
| 2021 | $6,218 | $101,800 | $52,570 | $49,230 |
| 2020 | $6,083 | $99,960 | $51,620 | $48,340 |
| 2019 | $5,900 | $95,640 | $49,390 | $46,250 |
| 2018 | $5,602 | $91,090 | $47,040 | $44,050 |
| 2017 | $5,885 | $88,010 | $45,450 | $42,560 |
| 2016 | $5,778 | $84,830 | $43,810 | $41,020 |
| 2015 | $5,759 | $79,890 | $41,260 | $38,630 |
| 2014 | $5,557 | $74,660 | $38,560 | $36,100 |
| 2013 | $5,473 | $74,840 | $38,650 | $36,190 |
Source: Public Records
Map
Nearby Homes
- 2221 Woodland Cir
- 303 Cedarbrook Rd
- 97 Midhurst Ct Unit 202
- 95 Midhurst Ct Unit 101
- 2132 Berkley Ct Unit 201A
- 47 Glencoe Ct Unit 102D
- 18 Newgate Ave
- 2308 Modaff Rd
- 23 Glencoe Ct Unit 202B
- 2301 Providence Ct
- 2206 Gleneagles Dr
- 2276 Kaskaskia Ct
- 309 Carriage Hill Rd
- 307 Leeds Ct
- 36 Oak Bluff Ct
- 44 Oak Bluff Ct
- 1751 S Washington St Unit 1
- 40 Harbor Ct Unit 304
- 51 Ford Ln
- 203 Settlers Ct
- 221 Split Oak Rd
- 229 Split Oak Rd
- 233 Split Oak Rd
- 217 Split Oak Rd
- 224 Split Oak Rd
- 230 Split Oak Rd Unit 3B
- 220 Split Oak Rd
- 2030 Springside Dr
- 213 Split Oak Rd
- 2032 Springside Dr
- 301 Eastland Ct
- 216 Split Oak Rd
- 2028 Springside Dr
- 2034 Springside Dr
- 2170 Countryside Cir
- 212 Split Oak Rd Unit 3B
- 2026 Springside Dr
- 305 Eastland Ct
- 209 Split Oak Rd
- 237 Briarheath Ln