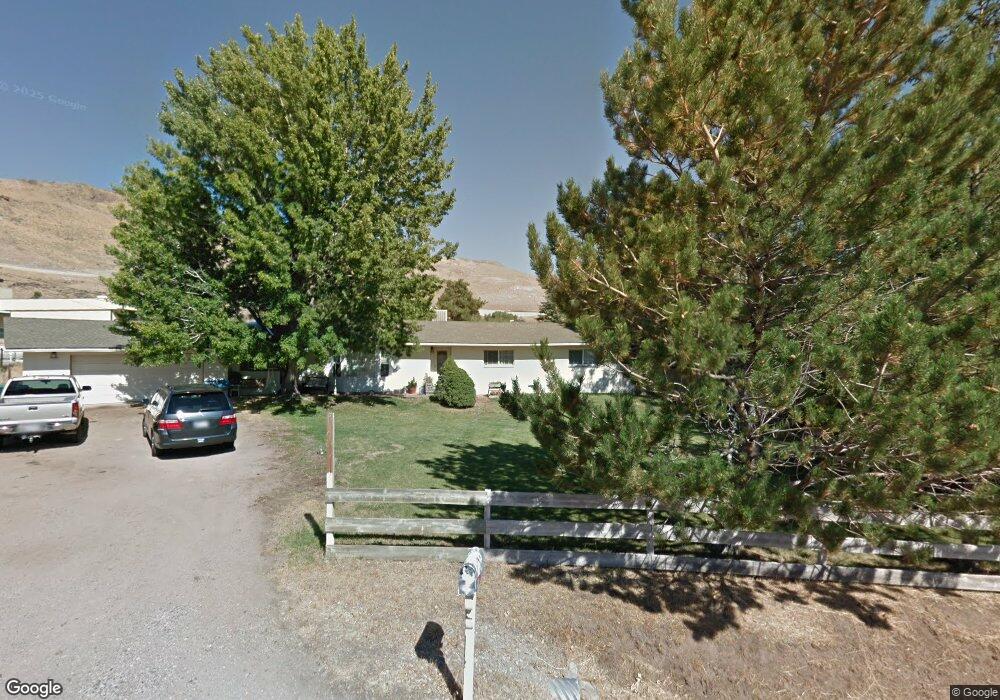
225 Surrey DR Donnay Reno, NV 89521
Pleasant Valley NeighborhoodEstimated Value: $785,616 - $976,000
4
Beds
3
Baths
2,638
Sq Ft
$337/Sq Ft
Est. Value
About This Home
This home is located at 225 Surrey DR Donnay, Reno, NV 89521 and is currently estimated at $889,904, approximately $337 per square foot. 225 Surrey DR Donnay is a home located in Washoe County with nearby schools including Pleasant Valley Elementary School, Marce Herz Middle School, and Galena High School.
Ownership History
Date
Name
Owned For
Owner Type
Purchase Details
Closed on
Jan 26, 2005
Sold by
Nash Mark R
Bought by
Nash Mark R and Nash Maureen M
Current Estimated Value
Home Financials for this Owner
Home Financials are based on the most recent Mortgage that was taken out on this home.
Original Mortgage
$282,500
Outstanding Balance
$138,843
Interest Rate
5.25%
Mortgage Type
Unknown
Estimated Equity
$751,061
Purchase Details
Closed on
Sep 18, 2003
Sold by
Nash Wanda M and The Wanda M Nash Living Trust
Bought by
Nash Mark R and Nash Maureen M
Home Financials for this Owner
Home Financials are based on the most recent Mortgage that was taken out on this home.
Original Mortgage
$142,180
Interest Rate
6.27%
Mortgage Type
Unknown
Purchase Details
Closed on
May 9, 1996
Sold by
Nash Wanda M and Lindley Wanda M
Bought by
Nash Wanda M
Purchase Details
Closed on
Dec 1, 1995
Sold by
Nash Mark R and Nash Maureen
Bought by
Nash Wanda M and Lindley Wanda M
Create a Home Valuation Report for This Property
The Home Valuation Report is an in-depth analysis detailing your home's value as well as a comparison with similar homes in the area
Home Values in the Area
Average Home Value in this Area
Purchase History
| Date | Buyer | Sale Price | Title Company |
|---|---|---|---|
| Nash Mark R | -- | -- | |
| Nash Mark R | -- | Western Title Incorporated | |
| Nash Mark R | $486,533 | Western Title Incorporated | |
| Nash Wanda M | -- | -- | |
| Nash Wanda M | $91,781 | Fidelity National Title Ins |
Source: Public Records
Mortgage History
| Date | Status | Borrower | Loan Amount |
|---|---|---|---|
| Open | Nash Mark R | $282,500 | |
| Closed | Nash Mark R | $142,180 |
Source: Public Records
Tax History Compared to Growth
Tax History
| Year | Tax Paid | Tax Assessment Tax Assessment Total Assessment is a certain percentage of the fair market value that is determined by local assessors to be the total taxable value of land and additions on the property. | Land | Improvement |
|---|---|---|---|---|
| 2025 | $1,967 | $123,237 | $84,000 | $39,237 |
| 2024 | $1,967 | $117,203 | $77,875 | $39,328 |
| 2023 | $1,910 | $108,089 | $71,750 | $36,339 |
| 2022 | $1,855 | $100,549 | $70,000 | $30,549 |
| 2021 | $1,801 | $87,519 | $58,625 | $28,894 |
| 2020 | $1,747 | $83,201 | $54,250 | $28,951 |
| 2019 | $1,696 | $80,185 | $52,500 | $27,685 |
| 2018 | $1,647 | $73,178 | $45,500 | $27,678 |
| 2017 | $1,582 | $62,154 | $35,000 | $27,154 |
| 2016 | $1,543 | $63,071 | $35,000 | $28,071 |
| 2015 | $1,538 | $49,809 | $21,000 | $28,809 |
| 2014 | $1,494 | $46,093 | $17,500 | $28,593 |
| 2013 | -- | $46,436 | $17,500 | $28,936 |
Source: Public Records
Map
Nearby Homes
- 22855 Carriage Dr
- 22860 Carriage Dr
- 5 Connie Way
- 000 No Street Name
- 20475 Temelec Way
- APN 05017037
- 247 Willbuck Rd
- APN 05017035
- 230 Shepherds Bush Ct
- 11601 Viewline Ct
- 229 S Earlham Ct
- 1140 Eastlake Blvd
- 330 Neilson Rd
- 315 Neilson Rd
- 307 Neilson Rd
- 202 Paddington Ct
- 11501 Sterling Canyon Dr Unit Ascente 154
- 5220 Shawna Ln
- 251 Theobald Ln
- 203 S Argyle Ct