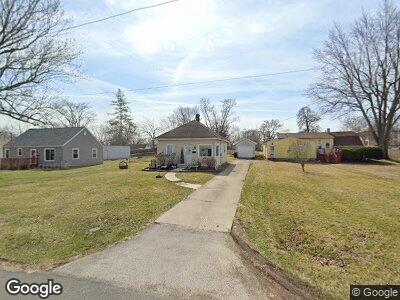
225 Tioga Ave Findlay, OH 45840
Estimated Value: $108,639 - $151,000
2
Beds
1
Bath
898
Sq Ft
$143/Sq Ft
Est. Value
About This Home
This home is located at 225 Tioga Ave, Findlay, OH 45840 and is currently estimated at $128,160, approximately $142 per square foot. 225 Tioga Ave is a home located in Hancock County with nearby schools including Northview Elementary School, Bigelow Hill Elementary School, and Glenwood Middle School.
Ownership History
Date
Name
Owned For
Owner Type
Purchase Details
Closed on
Apr 5, 2010
Sold by
Fannie Mae
Bought by
Weldy Linda L
Current Estimated Value
Purchase Details
Closed on
Mar 3, 2010
Sold by
Meyers Kelly A Hickle
Bought by
Federal National Mortgage Association
Purchase Details
Closed on
Sep 8, 1998
Sold by
Lane Lee
Bought by
Hickle Donald and Hickle Kelly
Home Financials for this Owner
Home Financials are based on the most recent Mortgage that was taken out on this home.
Original Mortgage
$61,861
Interest Rate
7.04%
Mortgage Type
FHA
Purchase Details
Closed on
Mar 2, 1998
Sold by
Ayers Patrick
Bought by
Lee Lane and Lee Jocelyn
Home Financials for this Owner
Home Financials are based on the most recent Mortgage that was taken out on this home.
Original Mortgage
$30,320
Interest Rate
7.5%
Mortgage Type
New Conventional
Purchase Details
Closed on
Jul 27, 1993
Bought by
Ayers Patrick R and Ayers Mary L
Purchase Details
Closed on
Sep 20, 1985
Bought by
Coppes Deloris I and Coppes Thomas
Create a Home Valuation Report for This Property
The Home Valuation Report is an in-depth analysis detailing your home's value as well as a comparison with similar homes in the area
Home Values in the Area
Average Home Value in this Area
Purchase History
| Date | Buyer | Sale Price | Title Company |
|---|---|---|---|
| Weldy Linda L | $21,000 | Sovereign Title Agency Llc | |
| Federal National Mortgage Association | $25,000 | Attorney | |
| Hickle Donald | $63,000 | -- | |
| Lee Lane | $37,900 | -- | |
| Ayers Patrick R | $36,000 | -- | |
| Coppes Deloris I | $21,000 | -- |
Source: Public Records
Mortgage History
| Date | Status | Borrower | Loan Amount |
|---|---|---|---|
| Open | Weldy Linda L | $70,000 | |
| Closed | Weldy Linda L | $60,000 | |
| Closed | Weldy Linda L | $15,000 | |
| Previous Owner | Meyers Kelly | $79,200 | |
| Previous Owner | Meyers Kelly A Hickle | $60,900 | |
| Previous Owner | Hickle Donald | $61,861 | |
| Previous Owner | Lee Lane | $30,320 |
Source: Public Records
Tax History Compared to Growth
Tax History
| Year | Tax Paid | Tax Assessment Tax Assessment Total Assessment is a certain percentage of the fair market value that is determined by local assessors to be the total taxable value of land and additions on the property. | Land | Improvement |
|---|---|---|---|---|
| 2024 | $878 | $24,710 | $4,540 | $20,170 |
| 2023 | $879 | $24,710 | $4,540 | $20,170 |
| 2022 | $876 | $24,710 | $4,540 | $20,170 |
| 2021 | $722 | $17,720 | $4,540 | $13,180 |
| 2020 | $721 | $17,720 | $4,540 | $13,180 |
| 2019 | $707 | $17,720 | $4,540 | $13,180 |
| 2018 | $687 | $15,810 | $3,240 | $12,570 |
| 2017 | $344 | $15,810 | $3,240 | $12,570 |
| 2016 | $690 | $15,810 | $3,240 | $12,570 |
| 2015 | $606 | $13,850 | $3,240 | $10,610 |
| 2014 | $606 | $13,850 | $3,240 | $10,610 |
| 2012 | $585 | $13,250 | $3,240 | $10,010 |
Source: Public Records
Map
Nearby Homes
- 2021 Knollwood Dr
- 236 Edinborough Dr
- 301 Lexington Ave
- 1934 Geffs Ave
- 1930 Geffs Ave
- 2640 Hollybrook Dr
- 421 Edinborough Dr
- 1808 Glenwood St
- 1909 Jennifer Ln
- 805 N Hill Trail
- 0 E Melrose Ave
- 509 Birch Ct
- 510 Rosewood Ave
- 536 Edinborough Dr
- 127 Madison Ave
- 3006 Norcrest St
- 444 Rector Ave
- 2512 Villa W Unit 1A
- 647 Villa S Unit 10A
- 1025 Crystal Ln