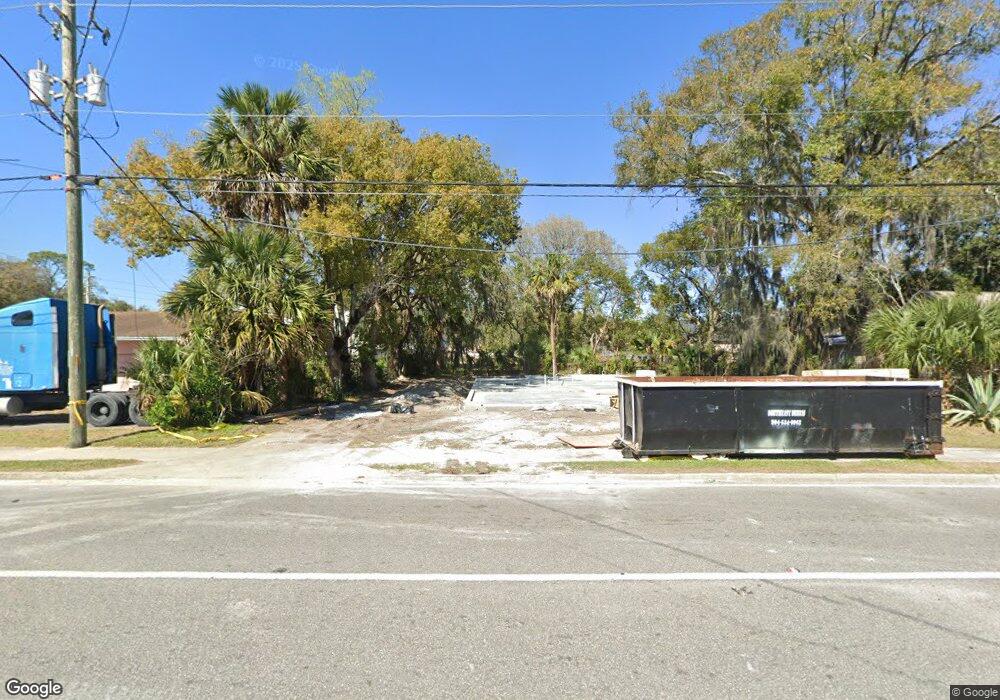
225 W 27th St Jacksonville, FL 32206
Brentwood NeighborhoodEstimated Value: $95,000 - $157,000
3
Beds
2
Baths
1,943
Sq Ft
$70/Sq Ft
Est. Value
About This Home
This home is located at 225 W 27th St, Jacksonville, FL 32206 and is currently estimated at $136,000, approximately $69 per square foot. 225 W 27th St is a home located in Duval County with nearby schools including North Shore Elementary School, Matthew W. Gilbert Middle School, and Jean Ribault High School.
Ownership History
Date
Name
Owned For
Owner Type
Purchase Details
Closed on
Dec 5, 2023
Sold by
Sunshine Lux Investments Llc
Bought by
Ramin Mahrnoodi Real Estate Llc
Current Estimated Value
Purchase Details
Closed on
Jul 20, 2023
Sold by
Jpmorgan Chase Bank National Association
Bought by
Sunshine Lux Investments Llc
Purchase Details
Closed on
May 22, 2023
Sold by
Waddell Rossie
Bought by
Jpmorgan Chase Bank National Association
Create a Home Valuation Report for This Property
The Home Valuation Report is an in-depth analysis detailing your home's value as well as a comparison with similar homes in the area
Home Values in the Area
Average Home Value in this Area
Purchase History
| Date | Buyer | Sale Price | Title Company |
|---|---|---|---|
| Ramin Mahrnoodi Real Estate Llc | $11,000 | Title Now | |
| Ramin Mahrnoodi Real Estate Llc | $11,000 | Title Now | |
| Sunshine Lux Investments Llc | $4,500 | Timios | |
| Jpmorgan Chase Bank National Association | $44,000 | -- |
Source: Public Records
Tax History Compared to Growth
Tax History
| Year | Tax Paid | Tax Assessment Tax Assessment Total Assessment is a certain percentage of the fair market value that is determined by local assessors to be the total taxable value of land and additions on the property. | Land | Improvement |
|---|---|---|---|---|
| 2025 | $388 | $21,735 | $21,735 | -- |
| 2024 | $388 | $21,735 | $21,735 | -- |
| 2023 | $1,027 | $51,084 | $18,975 | $32,109 |
| 2022 | $866 | $38,421 | $8,280 | $30,141 |
| 2021 | $212 | $24,540 | $0 | $0 |
| 2020 | $212 | $24,202 | $0 | $0 |
| 2019 | $212 | $23,658 | $0 | $0 |
| 2018 | $212 | $23,217 | $0 | $0 |
| 2017 | $212 | $22,740 | $0 | $0 |
| 2016 | $212 | $22,273 | $0 | $0 |
| 2015 | $212 | $22,119 | $0 | $0 |
| 2014 | $215 | $25,142 | $0 | $0 |
Source: Public Records
Map
Nearby Homes