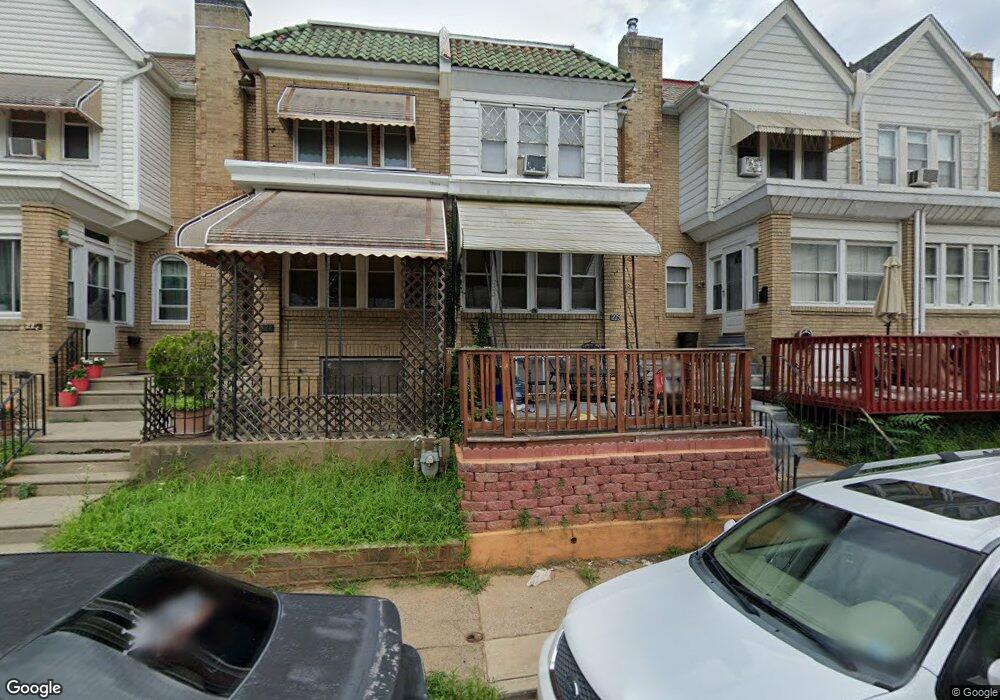
225 Wembly Rd Upper Darby, PA 19082
Estimated Value: $190,000 - $223,000
3
Beds
1
Bath
1,415
Sq Ft
$148/Sq Ft
Est. Value
About This Home
This home is located at 225 Wembly Rd, Upper Darby, PA 19082 and is currently estimated at $209,203, approximately $147 per square foot. 225 Wembly Rd is a home located in Delaware County with nearby schools including Bywood Elementary School, Upper Darby Kdg Center, and Upper Darby High School.
Ownership History
Date
Name
Owned For
Owner Type
Purchase Details
Closed on
Mar 7, 2008
Sold by
Zografakis Evans
Bought by
China Timothy
Current Estimated Value
Home Financials for this Owner
Home Financials are based on the most recent Mortgage that was taken out on this home.
Original Mortgage
$115,983
Outstanding Balance
$72,333
Interest Rate
5.76%
Mortgage Type
FHA
Estimated Equity
$136,870
Purchase Details
Closed on
Jan 31, 2008
Sold by
Rademacher James J and World Savings Bank Fsb
Bought by
Zografakis Evans
Home Financials for this Owner
Home Financials are based on the most recent Mortgage that was taken out on this home.
Original Mortgage
$115,983
Outstanding Balance
$72,333
Interest Rate
5.76%
Mortgage Type
FHA
Estimated Equity
$136,870
Purchase Details
Closed on
Dec 23, 1996
Sold by
Alaska Seaboard Partners Lp
Bought by
Rademacher James
Purchase Details
Closed on
May 8, 1996
Sold by
Osborne Ann
Bought by
Alaska Seaboard Partners
Create a Home Valuation Report for This Property
The Home Valuation Report is an in-depth analysis detailing your home's value as well as a comparison with similar homes in the area
Home Values in the Area
Average Home Value in this Area
Purchase History
| Date | Buyer | Sale Price | Title Company |
|---|---|---|---|
| China Timothy | $116,900 | Fidelity Natl Title Ins Co | |
| Zografakis Evans | $57,000 | None Available | |
| Rademacher James | $16,995 | -- | |
| Alaska Seaboard Partners | -- | -- |
Source: Public Records
Mortgage History
| Date | Status | Borrower | Loan Amount |
|---|---|---|---|
| Open | China Timothy | $115,983 |
Source: Public Records
Tax History
| Year | Tax Paid | Tax Assessment Tax Assessment Total Assessment is a certain percentage of the fair market value that is determined by local assessors to be the total taxable value of land and additions on the property. | Land | Improvement |
|---|---|---|---|---|
| 2025 | $3,691 | $87,270 | $22,140 | $65,130 |
| 2024 | $3,691 | $87,270 | $22,140 | $65,130 |
| 2023 | $3,656 | $87,270 | $22,140 | $65,130 |
| 2022 | $3,558 | $87,270 | $22,140 | $65,130 |
| 2021 | $4,797 | $87,270 | $22,140 | $65,130 |
| 2020 | $3,555 | $54,950 | $17,220 | $37,730 |
| 2019 | $3,492 | $54,950 | $17,220 | $37,730 |
| 2018 | $3,452 | $54,950 | $0 | $0 |
| 2017 | $3,362 | $54,950 | $0 | $0 |
| 2016 | $302 | $54,950 | $0 | $0 |
| 2015 | $302 | $54,950 | $0 | $0 |
| 2014 | $302 | $54,950 | $0 | $0 |
Source: Public Records
Map
Nearby Homes
Your Personal Tour Guide
Ask me questions while you tour the home.