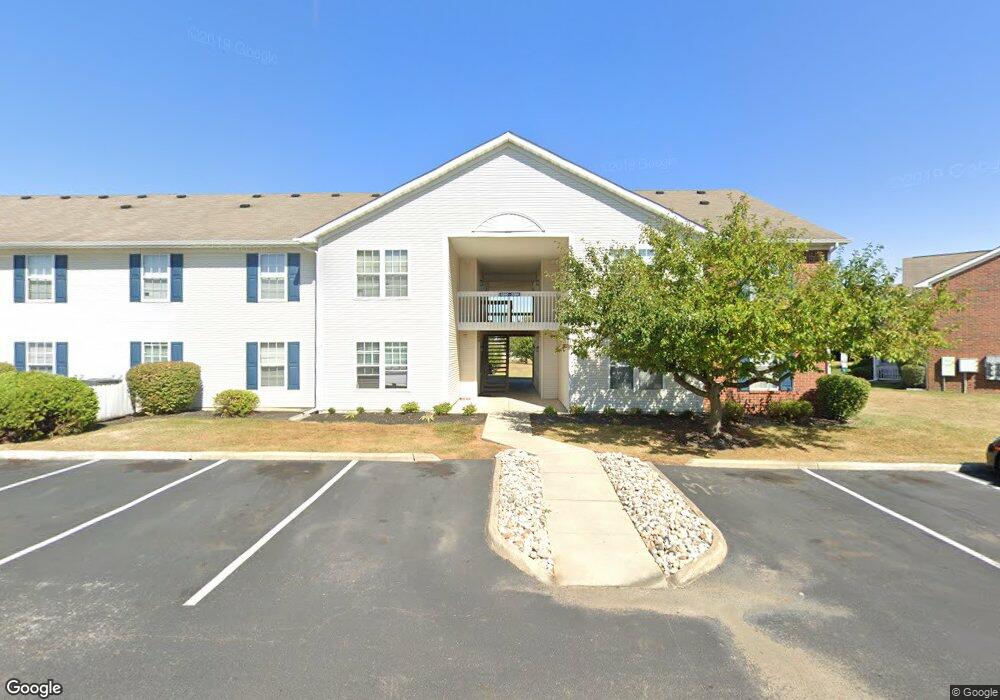
2250 Collier Crest Unit 2516 Grove City, OH 43123
Estimated Value: $115,000 - $220,000
1
Bed
1
Bath
678
Sq Ft
$259/Sq Ft
Est. Value
About This Home
This home is located at 2250 Collier Crest Unit 2516, Grove City, OH 43123 and is currently estimated at $175,333, approximately $258 per square foot. 2250 Collier Crest Unit 2516 is a home located in Franklin County with nearby schools including Highland Park Elementary School, Park Street Intermediate School, and Central Crossing High School.
Ownership History
Date
Name
Owned For
Owner Type
Purchase Details
Closed on
Jul 19, 2005
Sold by
Giller Rowland S and Giller Stacey M
Bought by
Tiffan Gary Dean and Tiffan Brenda Henrietta
Current Estimated Value
Home Financials for this Owner
Home Financials are based on the most recent Mortgage that was taken out on this home.
Original Mortgage
$617,185
Outstanding Balance
$322,594
Interest Rate
5.68%
Mortgage Type
Purchase Money Mortgage
Estimated Equity
-$147,261
Purchase Details
Closed on
May 22, 2001
Sold by
Triangle Properties Inc
Bought by
Giller Rowland S and Giller Stacey M
Home Financials for this Owner
Home Financials are based on the most recent Mortgage that was taken out on this home.
Original Mortgage
$707,400
Interest Rate
7.16%
Create a Home Valuation Report for This Property
The Home Valuation Report is an in-depth analysis detailing your home's value as well as a comparison with similar homes in the area
Home Values in the Area
Average Home Value in this Area
Purchase History
| Date | Buyer | Sale Price | Title Company |
|---|---|---|---|
| Tiffan Gary Dean | $775,000 | -- | |
| Giller Rowland S | $762,000 | Midland Celtic Title |
Source: Public Records
Mortgage History
| Date | Status | Borrower | Loan Amount |
|---|---|---|---|
| Open | Tiffan Gary Dean | $617,185 | |
| Previous Owner | Giller Rowland S | $707,400 | |
| Closed | Tiffan Gary Dean | $75,564 |
Source: Public Records
Tax History Compared to Growth
Tax History
| Year | Tax Paid | Tax Assessment Tax Assessment Total Assessment is a certain percentage of the fair market value that is determined by local assessors to be the total taxable value of land and additions on the property. | Land | Improvement |
|---|---|---|---|---|
| 2024 | $981 | $26,220 | $5,250 | $20,970 |
| 2023 | $964 | $26,220 | $5,250 | $20,970 |
| 2022 | $952 | $19,010 | $3,080 | $15,930 |
| 2021 | $971 | $19,010 | $3,080 | $15,930 |
| 2020 | $966 | $19,010 | $3,080 | $15,930 |
| 2019 | $996 | $17,290 | $2,800 | $14,490 |
| 2018 | $1,298 | $17,290 | $2,800 | $14,490 |
| 2017 | $1,030 | $17,290 | $2,800 | $14,490 |
| 2016 | $1,289 | $17,220 | $2,100 | $15,120 |
| 2015 | $1,605 | $17,220 | $2,100 | $15,120 |
| 2014 | $805 | $12,920 | $2,100 | $10,820 |
| 2013 | $399 | $12,915 | $2,100 | $10,815 |
Source: Public Records
Map
Nearby Homes
- 1962 Farmbrook Cir N Unit 6
- 1948 Farmbrook Cir S Unit 7
- 2564 Hardy Parkway St
- 1892 Farmbrook Cir S
- 2321 Hunterstown Dr
- 3271 Grovepark Dr
- 2000 Candlenut Cir
- 3058 Catan Loop Unit 3058
- 3140 Catan Loop Unit 3140
- 2365 Creek View Place
- 3343 Marshrun Dr
- 3187 Parkview Cir Unit 3187
- 3201 Parkview Cir
- 1896 Dyer Rd
- 2408 Warfield Dr
- 3400 Marshrun Dr
- 1969 Forest Lake Ct
- 3153 Scenic Way
- 3378 Josephine Cir
- 3156 Hoover Rd
- 2222 Collier Crest Unit 2234
- 2282 Collier Crest Unit 2282
- 2218 Collier Crest Unit 2230
- 2272 Collier Crest Unit 2272
- 2214 Collier Crest
- 2206 Collier Crest
- 2204 Collier Crest Unit 2204
- 2216 Collier Crest
- 2212 Collier Crest Unit 2212
- 2202 Collier Crest
- 2200 Collier Crest Unit 2284
- 2300 Collier Crest Unit 2334
- 2210 Collier Crest
- 2201 Collier Crest
- 2225 Grey Oaks Unit 2255
- 2350 Collier Crest
- 2354 Collier Crest Unit 2380
- 2247 Grey Oaks Unit 2259
- 2275 Grey Oaks Unit 2309
- 2351 Collier Crest