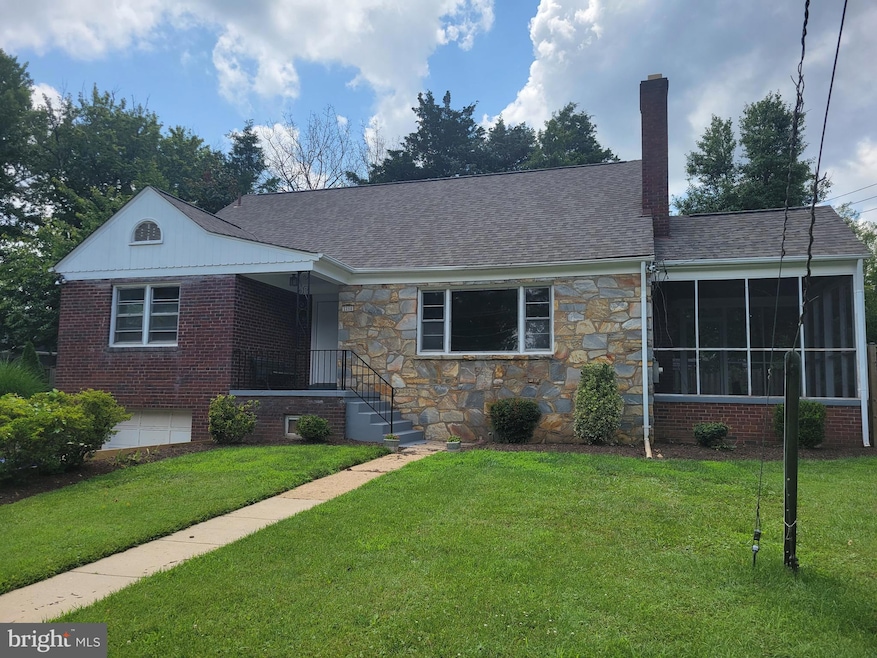
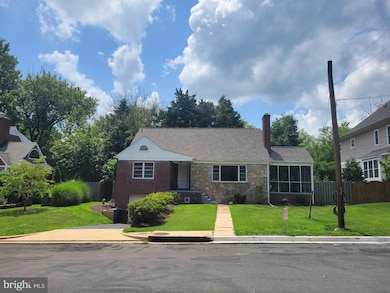
2250 N Quantico St Arlington, VA 22205
East Falls Church NeighborhoodHighlights
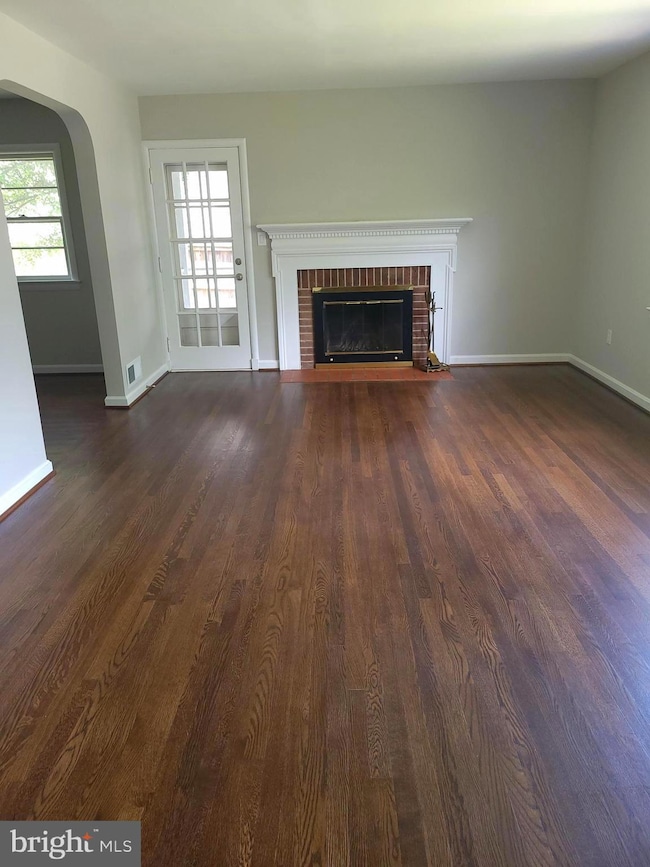
- Open Floorplan
- Partially Wooded Lot
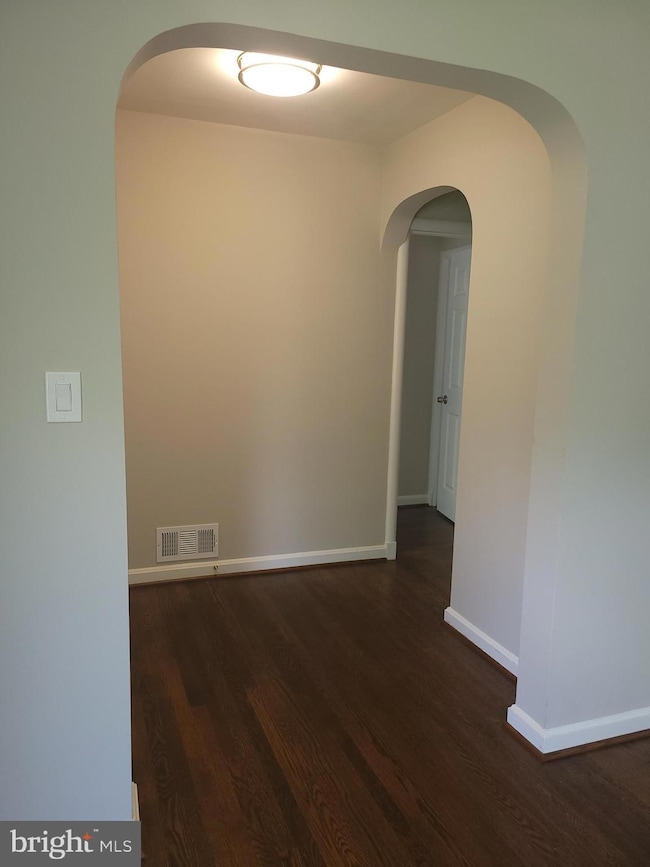
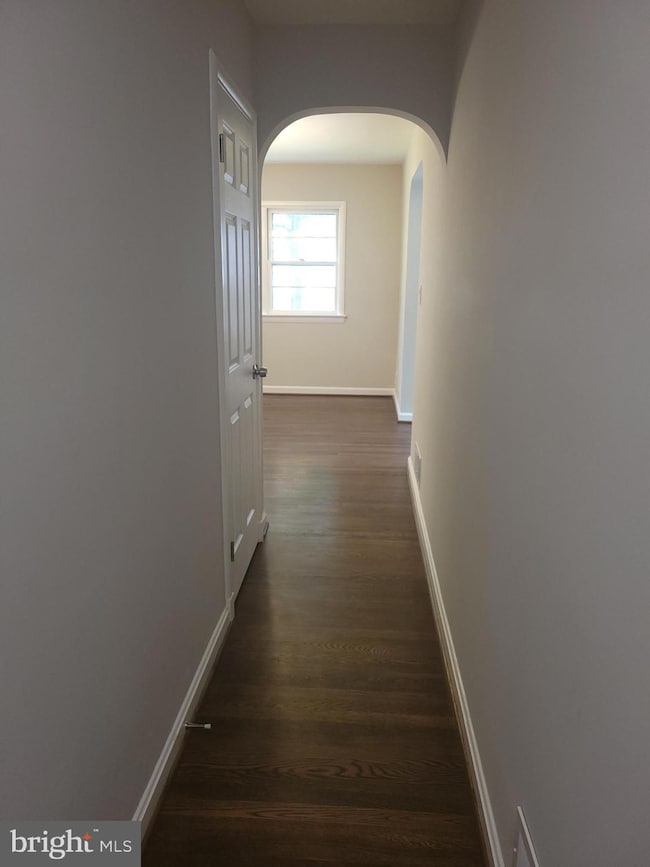
- Wood Flooring
- Tuckahoe Elementary School Rated A
- Traditional Architecture
- Main Floor Bedroom
About This Home
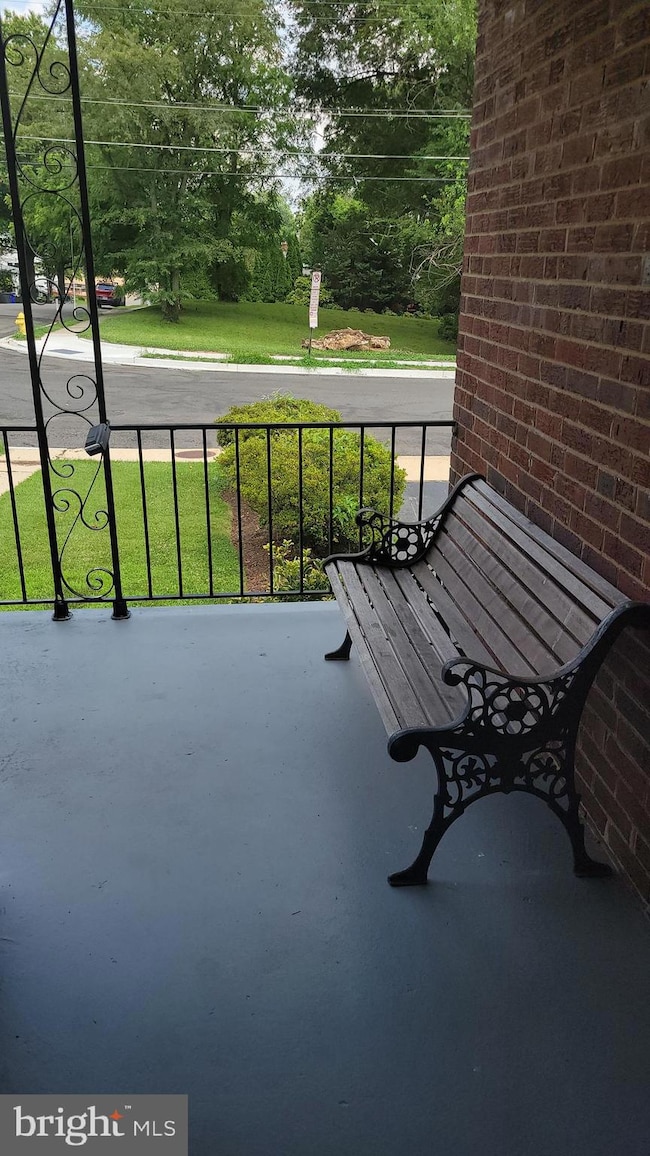
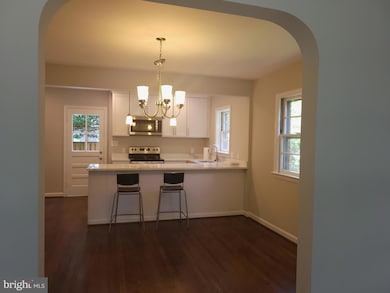
AVAILABLE 1/17/2026. LOCATION, SPACE and UPDATES, this home offers it all! 0.4 miles to East Falls Church Metro! W&OD trail accessible via bike/pedestrian bridge at Quantico/Washington Blvd. Updates include completely remodeled gourmet kitchen with soft-close cabinets, quartz countertops and stainless steel appliances. Hardwood floors throughout the main and upper levels (no carpet - no allergens!). Remodeled ensuite bath in primary bedroom located on the main level. Remodeled hall bath serves two additional main level bedrooms. Beautiful original arched openings in the foyer and living room. Access the spacious screened-in porch from the living room. New light fixtures and hardware throughout. Upstairs, two more large bedrooms have access to a shared bath which has been updated leaving the fun original tile work in place! Laminate flooring on lower level flex space and laundry room. Tons of additional storage in the work room located behind the garage! Perfect access to the private, fenced back yard from the kitchen, porch or the lower level. *The pictures show unit prior to current tenant occupancy. No more than two incomes to qualify.
Listing Agent
(703) 314-1661 sarah.wittig@longandfoster.com Long & Foster Real Estate, Inc. Listed on: 12/04/2025

Home Details
Home Type
- Single Family
Est. Annual Taxes
- $10,573
Year Built
- Built in 1954 | Remodeled in 2020
Lot Details
- 7,898 Sq Ft Lot
- Wood Fence
- Partially Wooded Lot
- Back Yard
- Property is in excellent condition
- Property is zoned R-6
Parking
- 1 Car Attached Garage
- Parking Storage or Cabinetry
- Driveway
Home Design
- Traditional Architecture
- Brick Exterior Construction
- Block Foundation
- Plaster Walls
Interior Spaces
- 2,400 Sq Ft Home
- Property has 2 Levels
- Open Floorplan
- Ceiling Fan
- Fireplace With Glass Doors
- Family Room Off Kitchen
- Living Room
- Combination Kitchen and Dining Room
- Screened Porch
- Utility Room
- Home Gym
Kitchen
- Gas Oven or Range
- Built-In Microwave
- Dishwasher
- Stainless Steel Appliances
- Disposal
Flooring
- Wood
- Laminate
- Tile or Brick
Bedrooms and Bathrooms
Laundry
- Laundry Room
- Dryer
- Washer
Partially Finished Basement
- Walk-Out Basement
- Interior Basement Entry
- Garage Access
- Workshop
- Laundry in Basement
Outdoor Features
- Screened Patio
Utilities
- Forced Air Heating and Cooling System
- Natural Gas Water Heater
Listing and Financial Details
- Residential Lease
- Security Deposit $5,200
- Tenant pays for cable TV, electricity, exterior maintenance, fireplace/flue cleaning, gas, gutter cleaning, heat, hot water, lawn/tree/shrub care, light bulbs/filters/fuses/alarm care, minor interior maintenance, snow removal, all utilities, windows/screens, water
- The owner pays for insurance, real estate taxes
- No Smoking Allowed
- 12-Month Min and 36-Month Max Lease Term
- Available 1/17/26
- $55 Application Fee
- Assessor Parcel Number 11-003-009
Community Details
Overview
- No Home Owners Association
- East Falls Church Subdivision
Pet Policy
- Pets allowed on a case-by-case basis
- Pet Deposit $500
Map
Source: Bright MLS
MLS Number: VAAR2066536
APN: 11-003-009
Disclaimer: Certain information contained herein is derived from information provided by parties other than Homes.com. All information provided is deemed reliable, but is not guaranteed to be accurate and should be independently verified.
![]() The data relating to real estate for sale on this website appears in part through the BRIGHT Internet Data Exchange program, a voluntary cooperative exchange of property listing data between licensed real estate brokerage firms, and is provided by BRIGHT through a licensing agreement.
The data relating to real estate for sale on this website appears in part through the BRIGHT Internet Data Exchange program, a voluntary cooperative exchange of property listing data between licensed real estate brokerage firms, and is provided by BRIGHT through a licensing agreement.
Listing information is from various brokers who participate in the Bright MLS IDX program and not all listings may be visible on the site.
The property information being provided on or through the website is for the personal, non-commercial use of consumers and such information may not be used for any purpose other than to identify prospective properties consumers may be interested in purchasing.
Some properties which appear for sale on the website may no longer be available because they are for instance, under contract, sold or are no longer being offered for sale.
Property information displayed is deemed reliable but is not guaranteed.
Copyright 2025 Bright MLS, Inc.
- 6243 22nd Rd N
- 6223 Langston Blvd
- 2339 N Powhatan St
- 2315 N Tuckahoe St
- 6314 Washington Blvd
- 6316 26th St N
- 2316 John Marshall Dr
- 6105 26th St N
- 6701 Washington Blvd Unit B
- 2322 N Nottingham St
- 2414 N Nottingham St
- 2632 N Sycamore St
- 2641 N Ohio St
- 1933 N Van Buren St
- 1404 N Powhatan St
- 2249 N Madison St
- 1922 N Van Buren St
- 1800 N Tuckahoe St
- 2515 N Lexington St
- 2200 N Westmoreland St Unit 516
- 6214 Langston Blvd Unit Joe Colley
- 2505 N Powhatan St
- 6703 Washington Blvd Unit F
- 6104 28th St N
- 2121 N Westmoreland St
- 1804 N Tuckahoe St Unit ID1037708P
- 2210 N Lexington St
- 2200 N Westmoreland St Unit 502
- 2200 N Westmoreland St Unit 516
- 2200 N Westmoreland St Unit 506
- 6924 Fairfax Dr Unit 140
- 6517 29th St N
- 2708 N Kensington St
- 450 N Washington St
- 1530 N Lancaster St Unit 1530 N Lancaster St
- 1530 N Lancaster St Unit 3
- 6356 12th St N
- 3105 N Toronto St
- 2104 N Jefferson St
- 6363 11th Rd N