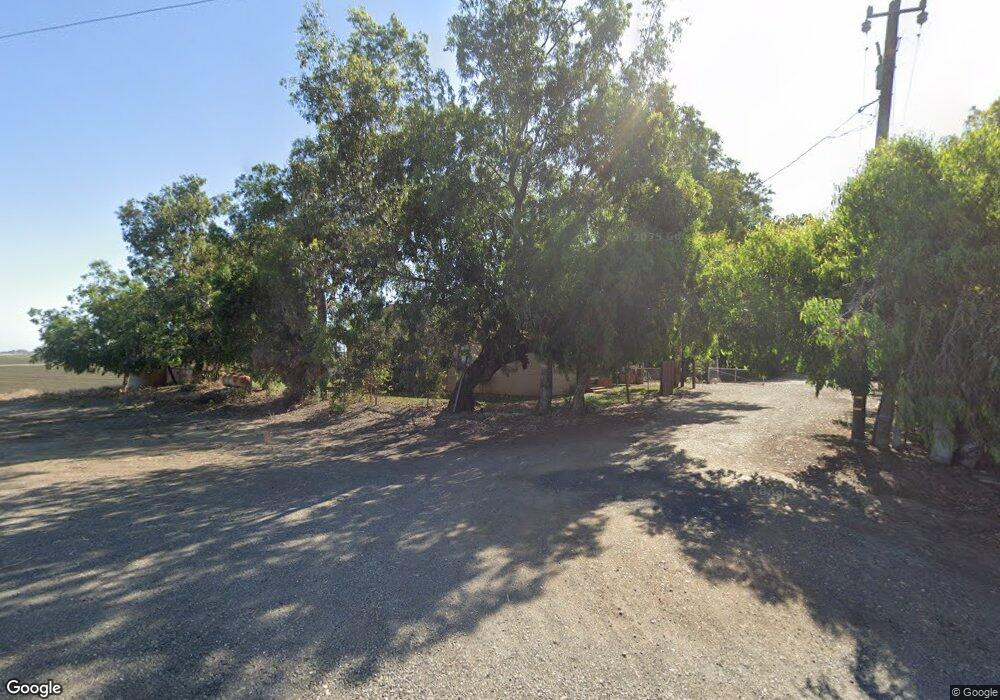
2250 S Inland Dr Stockton, CA 95206
Estimated Value: $545,000 - $1,073,542
3
Beds
1
Bath
1,266
Sq Ft
$617/Sq Ft
Est. Value
About This Home
This home is located at 2250 S Inland Dr, Stockton, CA 95206 and is currently estimated at $780,847, approximately $616 per square foot. 2250 S Inland Dr is a home located in San Joaquin County with nearby schools including Louis J. Villalovoz Elementary School, Earle E. Williams Middle School, and Merrill F. West High School.
Ownership History
Date
Name
Owned For
Owner Type
Purchase Details
Closed on
Mar 13, 2023
Sold by
Vierra-Yelland
Bought by
Eddie Vierra Farms Llc
Current Estimated Value
Purchase Details
Closed on
Feb 24, 2021
Sold by
Eddie Vierra Farms Llc
Bought by
Yelland Diana L and Vierra Larry E
Purchase Details
Closed on
Jul 10, 2006
Sold by
Haskin Laverne
Bought by
Haskin Edwin and Haskin Laverne M
Purchase Details
Closed on
May 30, 2006
Sold by
Eddie Vierra Farms Llc
Bought by
Vierra Mable J
Purchase Details
Closed on
Dec 28, 2005
Sold by
Vierra Rena T
Bought by
Eddie Vierra Farms Llc
Purchase Details
Closed on
Apr 28, 2005
Sold by
Vierra Mable J
Bought by
Vierra Rena T
Purchase Details
Closed on
Mar 15, 2001
Sold by
Vierra Willie
Bought by
Vierra William R and Vierra Mable J
Create a Home Valuation Report for This Property
The Home Valuation Report is an in-depth analysis detailing your home's value as well as a comparison with similar homes in the area
Home Values in the Area
Average Home Value in this Area
Purchase History
| Date | Buyer | Sale Price | Title Company |
|---|---|---|---|
| Eddie Vierra Farms Llc | -- | -- | |
| Yelland Diana L | -- | None Available | |
| Haskin Edwin | -- | None Available | |
| Haskin Laverne | -- | None Available | |
| Vierra Mable J | -- | First Amer Title Co Stockton | |
| Eddie Vierra Farms Llc | -- | None Available | |
| Vierra Rena T | $356,500 | First Amer Title Co | |
| Vierra William R | -- | -- |
Source: Public Records
Tax History Compared to Growth
Tax History
| Year | Tax Paid | Tax Assessment Tax Assessment Total Assessment is a certain percentage of the fair market value that is determined by local assessors to be the total taxable value of land and additions on the property. | Land | Improvement |
|---|---|---|---|---|
| 2025 | $5,621 | $363,979 | $298,395 | $65,584 |
| 2024 | $5,290 | $356,844 | $292,545 | $64,299 |
| 2023 | $5,230 | $349,848 | $286,809 | $63,039 |
| 2022 | $5,152 | $342,989 | $281,186 | $61,803 |
| 2021 | $5,108 | $336,265 | $275,673 | $60,592 |
| 2020 | $5,084 | $332,818 | $272,847 | $59,971 |
| 2019 | $5,027 | $326,294 | $267,498 | $58,796 |
| 2018 | $4,965 | $319,897 | $262,253 | $57,644 |
| 2017 | $4,786 | $313,625 | $257,111 | $56,514 |
| 2016 | $4,825 | $307,478 | $252,072 | $55,406 |
| 2014 | $4,103 | $254,272 | $200,765 | $53,507 |
Source: Public Records
Map
Nearby Homes
- 2336 Amboy Ave
- 2333 Amboy Ave
- 3404 S Inland Dr
- 5989 S Inland Dr
- 12500-14250 W Lower Jones Rd
- 5752 Saint Andrews Dr
- 4119 Spyglass Dr
- 5143 Poppy Hills Cir
- 5036 Spanish Bay Cir
- 3708 Michigan Ave
- 3112 Wendell Ave
- 3342 Cove Cir
- 4583 Pine Valley Cir
- 3865 Gleneagles Dr
- 3314 Cove Cir
- 4958 Bay View Cir
- 4335 Gleneagles Ct
- 3663 Saint Andrews Dr Unit 16
- 3621 de Ovan Ave
- 3653 Saint Andrews Dr Unit 14
- 2284 S Inland Dr
- 223-A & B E Jefferson St
- 4017 S Turnpike Rd
- 3993 S Turnpike Rd
- 3911 S Turnpike Rd
- 820 S Worth
- 4851 S Maybeck Rd
- 0 S Sutter St Unit 222048312
- 1535 Gauntlet Dr
- 212 Frank West CI
- 3904 S Manthey Rd
- 3904 Manthey
- 7700 Jacobs Rd
- 3422 S Inland Dr
- 7700 W Jacobs Rd
- 8119 Jacobs Rd
- 6514 Jacobs Rd
- 6813 California 4