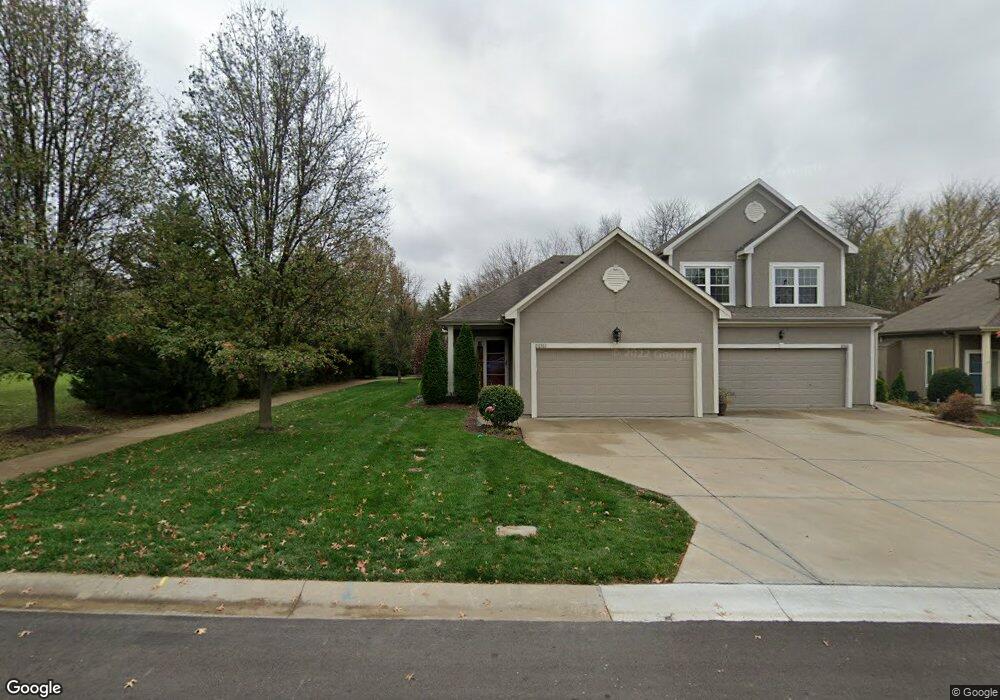
22511 W 71st Terrace Shawnee, KS 66227
Estimated Value: $338,000 - $368,838
3
Beds
3
Baths
1,232
Sq Ft
$289/Sq Ft
Est. Value
About This Home
This home is located at 22511 W 71st Terrace, Shawnee, KS 66227 and is currently estimated at $356,460, approximately $289 per square foot. 22511 W 71st Terrace is a home located in Johnson County with nearby schools including Horizon Elementary School, Mill Creek Middle School, and Mill Valley High School.
Ownership History
Date
Name
Owned For
Owner Type
Purchase Details
Closed on
Apr 29, 2022
Sold by
Lee Wolters Ronald
Bought by
Wolters Paul Matthew and Wolters Kathryn Sue
Current Estimated Value
Home Financials for this Owner
Home Financials are based on the most recent Mortgage that was taken out on this home.
Original Mortgage
$186,750
Outstanding Balance
$155,175
Interest Rate
4.4%
Mortgage Type
New Conventional
Estimated Equity
$201,285
Purchase Details
Closed on
Jul 31, 2007
Sold by
Wolters Paul M and Wolters Kathryn S
Bought by
Wolters Ronald Lee and Wolters Kathleen Joy
Home Financials for this Owner
Home Financials are based on the most recent Mortgage that was taken out on this home.
Original Mortgage
$194,039
Interest Rate
6.64%
Mortgage Type
VA
Purchase Details
Closed on
Dec 1, 2005
Sold by
Willow Ridge Construction Llc
Bought by
Wolters Paul M and Wolters Kathryn S
Create a Home Valuation Report for This Property
The Home Valuation Report is an in-depth analysis detailing your home's value as well as a comparison with similar homes in the area
Home Values in the Area
Average Home Value in this Area
Purchase History
| Date | Buyer | Sale Price | Title Company |
|---|---|---|---|
| Wolters Paul Matthew | -- | Security 1St Title | |
| Wolters Ronald Lee | -- | Kansas City Title | |
| Wolters Paul M | -- | First American Title Insuran |
Source: Public Records
Mortgage History
| Date | Status | Borrower | Loan Amount |
|---|---|---|---|
| Open | Wolters Paul Matthew | $186,750 | |
| Previous Owner | Wolters Ronald Lee | $194,039 |
Source: Public Records
Tax History Compared to Growth
Tax History
| Year | Tax Paid | Tax Assessment Tax Assessment Total Assessment is a certain percentage of the fair market value that is determined by local assessors to be the total taxable value of land and additions on the property. | Land | Improvement |
|---|---|---|---|---|
| 2024 | $4,210 | $36,421 | $5,497 | $30,924 |
| 2023 | $4,175 | $35,558 | $5,497 | $30,061 |
| 2022 | $3,720 | $31,039 | $4,393 | $26,646 |
| 2021 | $3,699 | $29,578 | $3,824 | $25,754 |
| 2020 | $3,633 | $28,785 | $3,824 | $24,961 |
| 2019 | $3,404 | $26,565 | $3,289 | $23,276 |
| 2018 | $3,227 | $24,955 | $3,289 | $21,666 |
| 2017 | $3,144 | $23,713 | $2,990 | $20,723 |
| 2016 | $2,911 | $21,678 | $2,990 | $18,688 |
| 2015 | $2,926 | $21,494 | $2,990 | $18,504 |
| 2013 | -- | $18,860 | $2,990 | $15,870 |
Source: Public Records
Map
Nearby Homes
- 22707 W 73rd St
- 9309 Aminda St
- 7342 Mccoy St
- 23136 W 71st Terrace
- 23154 W 71st Terrace
- 23217 W 71st Terrace
- 7153 Meadow View St
- 7101 Meadow View St
- 00 75th St
- 000 75th St
- 0000 75th St
- 23300 W 71st St
- 7134 Hedge Lane Terrace
- 7908 Millridge St
- 22410 W 76th St
- 22408 W 76th St
- 22310 W 76th St
- 22312 W 76th St
- 7323 Meadowsweet Ln
- 0 Hedge Lane Terrace
- 22513 W 71st Terrace
- 22517 W 71st Terrace
- 7126 Aminda Dr
- 22519 W 71st Terrace
- 7130 Aminda Dr
- 7130 Aminda St
- 7126 Aminda St
- 22523 W 71st Terrace
- 7134 Aminda Dr
- 22510 W 71st Terrace
- 22512 W 71st Terrace
- 7116 Aminda Dr
- 22525 W 71st Terrace
- 22522 W 71st Terrace
- 7138 Aminda Dr
- 7138 Aminda Dr
- 7116 Aminda St
- 22524 W 71st Terrace
- 22529 W 71st Terrace
- 7112 Aminda St