Estimated Value: $218,000 - $261,661
3
Beds
2
Baths
1,482
Sq Ft
$165/Sq Ft
Est. Value
About This Home
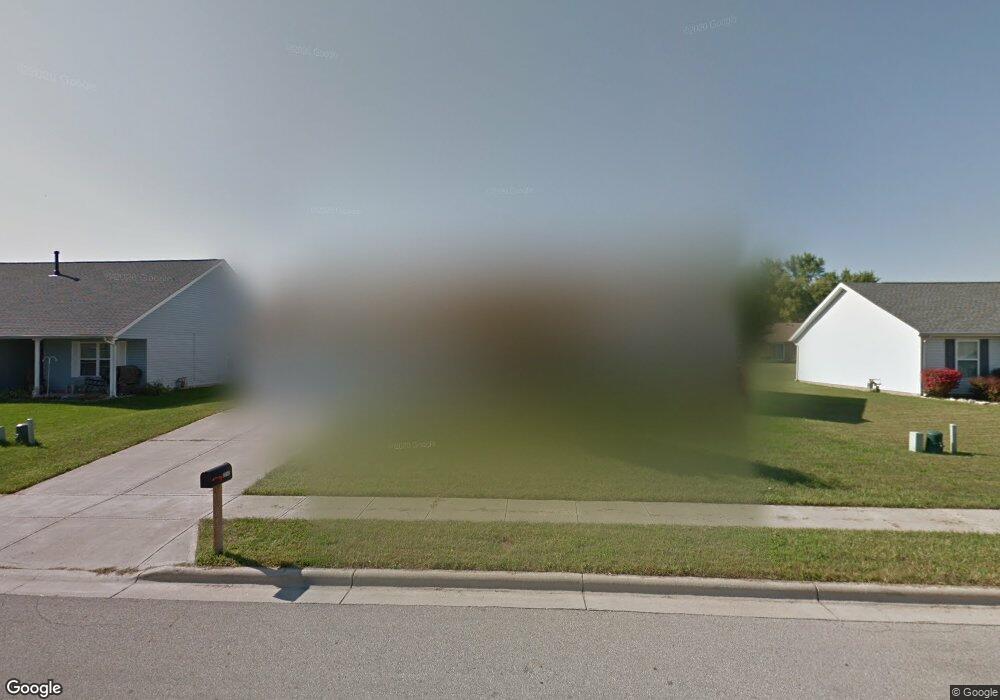
This home is located at 2252 Commonwealth Dr, Xenia, OH 45385 and is currently estimated at $245,165, approximately $165 per square foot. 2252 Commonwealth Dr is a home located in Greene County with nearby schools including Xenia High School, Summit Academy Community School for Alternative Learners - Xenia, and Legacy Christian Academy.
Ownership History
Date
Name
Owned For
Owner Type
Purchase Details
Closed on
Apr 27, 2012
Sold by
Security National Bank & Trust Co
Bought by
Stewart Benjamin A
Current Estimated Value
Home Financials for this Owner
Home Financials are based on the most recent Mortgage that was taken out on this home.
Original Mortgage
$94,541
Outstanding Balance
$66,568
Interest Rate
4.25%
Mortgage Type
FHA
Estimated Equity
$178,597
Purchase Details
Closed on
Sep 8, 2011
Sold by
Ellison Kelly L
Bought by
Security National Bank & Trust Co
Purchase Details
Closed on
Dec 29, 2004
Sold by
Sensible Shelter Inc
Bought by
Ellison Kelly L
Home Financials for this Owner
Home Financials are based on the most recent Mortgage that was taken out on this home.
Original Mortgage
$92,130
Interest Rate
5.78%
Mortgage Type
Unknown
Create a Home Valuation Report for This Property
The Home Valuation Report is an in-depth analysis detailing your home's value as well as a comparison with similar homes in the area
Home Values in the Area
Average Home Value in this Area
Purchase History
| Date | Buyer | Sale Price | Title Company |
|---|---|---|---|
| Stewart Benjamin A | $97,000 | None Available | |
| Security National Bank & Trust Co | $76,000 | None Available | |
| Ellison Kelly L | $123,100 | -- |
Source: Public Records
Mortgage History
| Date | Status | Borrower | Loan Amount |
|---|---|---|---|
| Open | Stewart Benjamin A | $94,541 | |
| Previous Owner | Ellison Kelly L | $92,130 | |
| Closed | Ellison Kelly L | $30,000 |
Source: Public Records
Tax History Compared to Growth
Tax History
| Year | Tax Paid | Tax Assessment Tax Assessment Total Assessment is a certain percentage of the fair market value that is determined by local assessors to be the total taxable value of land and additions on the property. | Land | Improvement |
|---|---|---|---|---|
| 2024 | $2,988 | $69,820 | $19,070 | $50,750 |
| 2023 | $2,988 | $69,820 | $19,070 | $50,750 |
| 2022 | $2,616 | $52,140 | $12,710 | $39,430 |
| 2021 | $2,651 | $52,140 | $12,710 | $39,430 |
| 2020 | $2,540 | $52,140 | $12,710 | $39,430 |
| 2019 | $2,099 | $40,560 | $9,500 | $31,060 |
| 2018 | $2,107 | $40,560 | $9,500 | $31,060 |
| 2017 | $2,046 | $40,560 | $9,500 | $31,060 |
| 2016 | $2,080 | $39,300 | $9,500 | $29,800 |
| 2015 | $2,086 | $39,300 | $9,500 | $29,800 |
| 2014 | $1,998 | $39,300 | $9,500 | $29,800 |
Source: Public Records
Map
Nearby Homes
- 2499 Jenny Marie Dr
- 1255 Colorado Dr
- 2540 Jenny Marie Dr
- 1107 Arkansas Dr
- 2421 Louisiana Dr
- 2540 Cornwall Dr
- 1908 Whitt St
- 0 Berkshire Dr Unit 942854
- 1866 Roxbury Dr
- 2345 Tennessee Dr
- 1829 Gayhart Dr
- 1403 Texas Dr
- 1769 Gayhart Dr
- 2257 Maryland Dr
- 2784 Greystoke Dr
- 2144 Tandem Dr
- 910 Wright Ave
- 1778 Arapaho Dr
- 2692 Kingman Dr
- 2705 Tennessee Dr
- 2268 Commonwealth Dr
- 2385 Pembury Dr
- 2405 Pembury Dr
- 2369 Pembury Dr
- 2220 Commonwealth Dr
- 2253 Commonwealth Dr
- 2237 Commonwealth Dr
- 2269 Commonwealth Dr
- 2353 Pembury Dr
- 2290 Commonwealth Dr
- 2221 Commonwealth Dr
- 2285 Commonwealth Dr
- 2206 Commonwealth Dr
- 2129 Dundee Dr
- 2205 Commonwealth Dr
- 2160 Dundee Dr
- 2304 Commonwealth Dr
- 2145 Dundee Dr
- 2337 Pembury Dr
- 2364 Pembury Dr