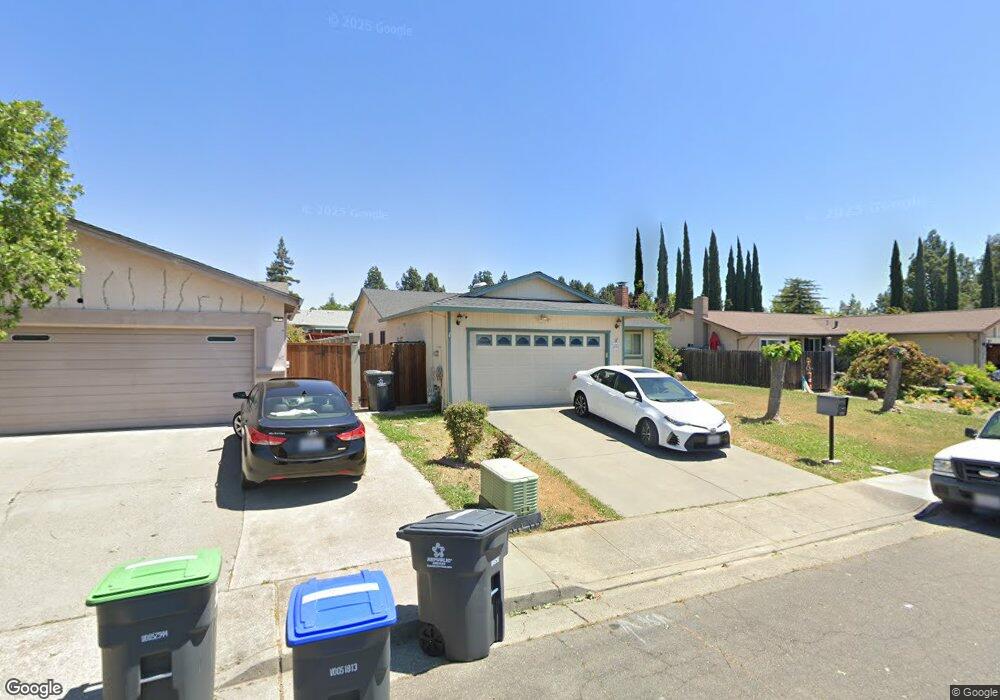
2252 Older Place Fairfield, CA 94533
Estimated Value: $472,000 - $557,000
4
Beds
2
Baths
1,456
Sq Ft
$352/Sq Ft
Est. Value
About This Home
This home is located at 2252 Older Place, Fairfield, CA 94533 and is currently estimated at $513,125, approximately $352 per square foot. 2252 Older Place is a home located in Solano County with nearby schools including Tolenas Academy of Music & Media, Grange Middle School, and Fairfield High School.
Ownership History
Date
Name
Owned For
Owner Type
Purchase Details
Closed on
Jun 18, 2019
Sold by
Blas Carl A and Blas Sonja N
Bought by
Blas Carl A and Blas Sonja N
Current Estimated Value
Home Financials for this Owner
Home Financials are based on the most recent Mortgage that was taken out on this home.
Original Mortgage
$320,000
Outstanding Balance
$281,358
Interest Rate
4.1%
Mortgage Type
New Conventional
Estimated Equity
$231,767
Purchase Details
Closed on
Feb 5, 2015
Sold by
Hurtado Antonio
Bought by
Blas Carl A and Blas Sonja N
Home Financials for this Owner
Home Financials are based on the most recent Mortgage that was taken out on this home.
Original Mortgage
$6,750
Interest Rate
3.8%
Mortgage Type
Second Mortgage Made To Cover Down Payment
Purchase Details
Closed on
Jul 29, 2013
Sold by
Hurtado Antonio
Bought by
Hurtado Antonio
Create a Home Valuation Report for This Property
The Home Valuation Report is an in-depth analysis detailing your home's value as well as a comparison with similar homes in the area
Home Values in the Area
Average Home Value in this Area
Purchase History
| Date | Buyer | Sale Price | Title Company |
|---|---|---|---|
| Blas Carl A | -- | Fidelity Title Co Syn | |
| Blas Carl A | $225,000 | Fidelity National Title Co | |
| Hurtado Antonio | -- | None Available |
Source: Public Records
Mortgage History
| Date | Status | Borrower | Loan Amount |
|---|---|---|---|
| Open | Blas Carl A | $320,000 | |
| Closed | Blas Carl A | $6,750 | |
| Closed | Blas Carl A | $220,924 |
Source: Public Records
Tax History Compared to Growth
Tax History
| Year | Tax Paid | Tax Assessment Tax Assessment Total Assessment is a certain percentage of the fair market value that is determined by local assessors to be the total taxable value of land and additions on the property. | Land | Improvement |
|---|---|---|---|---|
| 2025 | $3,248 | $289,636 | $72,106 | $217,530 |
| 2024 | $3,248 | $283,958 | $70,693 | $213,265 |
| 2023 | $3,149 | $278,391 | $69,307 | $209,084 |
| 2022 | $3,110 | $272,934 | $67,949 | $204,985 |
| 2021 | $3,080 | $267,583 | $66,617 | $200,966 |
| 2020 | $3,008 | $264,840 | $65,934 | $198,906 |
| 2019 | $2,934 | $259,648 | $64,642 | $195,006 |
| 2018 | $3,029 | $254,558 | $63,375 | $191,183 |
| 2017 | $2,889 | $249,568 | $62,133 | $187,435 |
| 2016 | $2,864 | $244,675 | $60,915 | $183,760 |
| 2015 | $652 | $64,357 | $11,986 | $52,371 |
| 2014 | $644 | $63,098 | $11,752 | $51,346 |
Source: Public Records
Map
Nearby Homes
- 2049 Harte Ct
- 2120 Merritt Place
- 2056 Davis Dr
- 1461 Festival Ln
- 1571 Luminate Ln
- 1461 Monument Ln
- 1460 Monument Ln
- 1465 Monument Ln
- 1465 Festival Ln
- 2350 Gull Ct
- 1575 Feast Ct
- 1571 Feast Ct
- 1473 Monument Ln
- 1477 Festival Ln
- 1477 Monument Ln
- 1481 Monument Ln
- 1480 Monument Ln
- 1328 Horizon Cir
- Azalea Plan at Villages at Fairfield - Melrose at the Villages
- Begonia Plan at Villages at Fairfield - Melrose at the Villages
- 2244 Older Place
- 2260 Older Place
- 2241 Ross Place
- 2233 Ross Place
- 2232 Older Place
- 2268 Older Place
- 2249 Ross Place
- 2225 Ross Place
- 2269 Older Place
- 2261 Older Place
- 2277 Older Place
- 2257 Ross Place
- 2224 Older Place
- 2276 Older Place
- 2253 Older Place
- 2217 Ross Place
- 2265 Ross Place
- 1463 Quail Dr
- 2247 Older Place
- 2216 Older Place