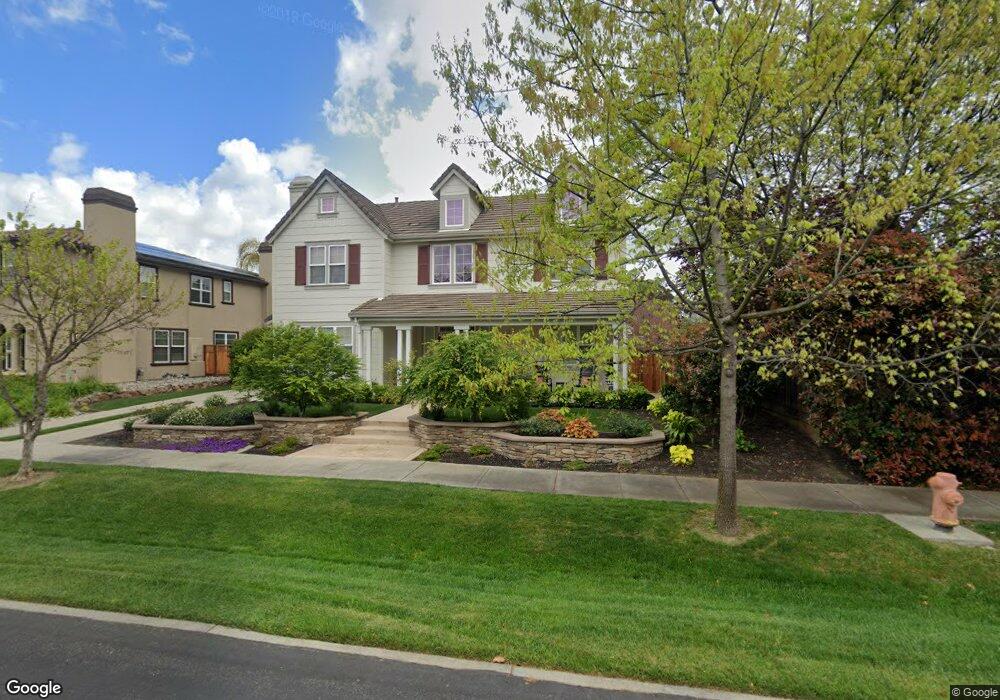
2252 Rees Cir Livermore, CA 94550
Estimated Value: $1,839,000 - $1,990,000
6
Beds
4
Baths
3,547
Sq Ft
$537/Sq Ft
Est. Value
About This Home
This home is located at 2252 Rees Cir, Livermore, CA 94550 and is currently estimated at $1,904,059, approximately $536 per square foot. 2252 Rees Cir is a home located in Alameda County with nearby schools including Arroyo Seco Elementary School, East Avenue Middle School, and Livermore High School.
Ownership History
Date
Name
Owned For
Owner Type
Purchase Details
Closed on
Sep 30, 2019
Sold by
Foust Nunes Kandy
Bought by
Foust Nunes Kandy and Nunes James Michael
Current Estimated Value
Home Financials for this Owner
Home Financials are based on the most recent Mortgage that was taken out on this home.
Original Mortgage
$875,000
Outstanding Balance
$764,967
Interest Rate
3.4%
Mortgage Type
New Conventional
Estimated Equity
$1,139,092
Purchase Details
Closed on
Jul 3, 2002
Sold by
Ghc Investments Llc
Bought by
Foust Nunes Kandy
Purchase Details
Closed on
Mar 18, 2002
Sold by
Nunes James Michael
Bought by
Foust Nunes Kandy
Home Financials for this Owner
Home Financials are based on the most recent Mortgage that was taken out on this home.
Original Mortgage
$749,875
Interest Rate
6.69%
Mortgage Type
Stand Alone First
Create a Home Valuation Report for This Property
The Home Valuation Report is an in-depth analysis detailing your home's value as well as a comparison with similar homes in the area
Purchase History
| Date | Buyer | Sale Price | Title Company |
|---|---|---|---|
| Foust Nunes Kandy | -- | None Available | |
| Foust Nunes Kandy | -- | Chicago Title Co | |
| Foust Nunes Kandy | -- | Chicago Title Co |
Source: Public Records
Mortgage History
| Date | Status | Borrower | Loan Amount |
|---|---|---|---|
| Open | Foust Nunes Kandy | $875,000 | |
| Previous Owner | Foust Nunes Kandy | $749,875 |
Source: Public Records
Tax History
| Year | Tax Paid | Tax Assessment Tax Assessment Total Assessment is a certain percentage of the fair market value that is determined by local assessors to be the total taxable value of land and additions on the property. | Land | Improvement |
|---|---|---|---|---|
| 2025 | $14,090 | $1,093,196 | $330,189 | $770,007 |
| 2024 | $14,090 | $1,071,628 | $323,716 | $754,912 |
| 2023 | $13,882 | $1,057,486 | $317,371 | $740,115 |
| 2022 | $13,664 | $1,029,754 | $311,149 | $725,605 |
| 2021 | $13,413 | $1,009,432 | $305,050 | $711,382 |
| 2020 | $13,017 | $1,006,017 | $301,924 | $704,093 |
| 2019 | $13,164 | $986,295 | $296,005 | $690,290 |
| 2018 | $12,849 | $966,960 | $290,202 | $676,758 |
| 2017 | $12,450 | $948,006 | $284,514 | $663,492 |
| 2016 | $12,054 | $929,424 | $278,937 | $650,487 |
| 2015 | $11,338 | $915,468 | $274,749 | $640,719 |
| 2014 | $10,632 | $850,000 | $255,000 | $595,000 |
Source: Public Records
Map
Nearby Homes
- 5590 Hopps Ln
- 5454 Stockton Loop
- 5218 Norma Way
- 2779 Silverado Ct
- 1762 Cheryl Dr
- 5143 Tesla Rd
- 1368 Pegan Common
- 1411 Justine Ct
- 4669 Almond Cir
- 838 Hazel St
- 1147 Rebecca Dr
- 973 Jessica Dr
- 732 Hazel St
- 4844 Mulqueeney Common
- 4115 Freeda Ct
- 6741 Tesla Rd
- 337 Chris Common Unit 111
- 4671 Laurie Common Unit 105
- 4671 Laurie Common Unit 103
- 5221 Lenore Ave
Your Personal Tour Guide
Ask me questions while you tour the home.