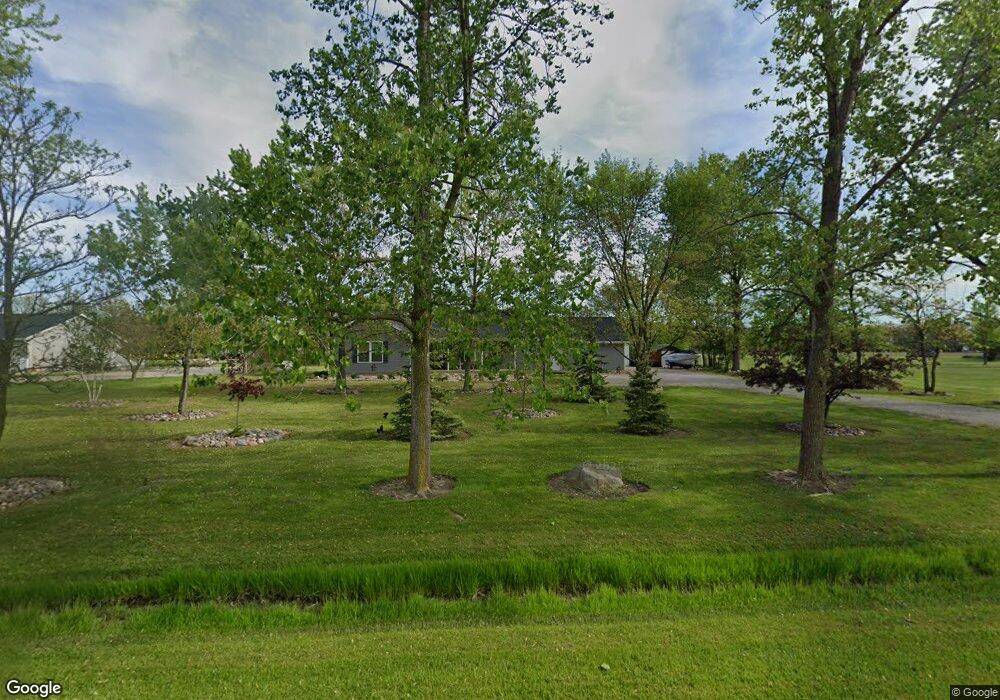
22521 Def Paulding Co Line Rd Defiance, OH 43512
Estimated Value: $208,000 - $270,000
3
Beds
2
Baths
1,330
Sq Ft
$176/Sq Ft
Est. Value
About This Home
This home is located at 22521 Def Paulding Co Line Rd, Defiance, OH 43512 and is currently estimated at $233,543, approximately $175 per square foot. 22521 Def Paulding Co Line Rd is a home located in Defiance County with nearby schools including Defiance Elementary School, Defiance Middle School, and Defiance High School.
Ownership History
Date
Name
Owned For
Owner Type
Purchase Details
Closed on
Nov 20, 2008
Sold by
Velasquez Reymundo V
Bought by
Alvarado Shannon K
Current Estimated Value
Purchase Details
Closed on
Oct 31, 2007
Sold by
Musch David J and Musch Kimberly
Bought by
Alvarado Shannon K and Velasquez Reymundo
Home Financials for this Owner
Home Financials are based on the most recent Mortgage that was taken out on this home.
Original Mortgage
$144,100
Interest Rate
6.38%
Mortgage Type
Unknown
Purchase Details
Closed on
Sep 3, 1996
Bought by
Alvarado Shannon K
Purchase Details
Closed on
Mar 27, 1996
Bought by
Alvarado Shannon K
Purchase Details
Closed on
Jan 5, 1996
Bought by
Alvarado Shannon K
Purchase Details
Closed on
Jan 20, 1994
Bought by
Alvarado Shannon K
Create a Home Valuation Report for This Property
The Home Valuation Report is an in-depth analysis detailing your home's value as well as a comparison with similar homes in the area
Home Values in the Area
Average Home Value in this Area
Purchase History
| Date | Buyer | Sale Price | Title Company |
|---|---|---|---|
| Alvarado Shannon K | -- | -- | |
| Alvarado Shannon K | $108,075 | -- | |
| Alvarado Shannon K | -- | -- | |
| Alvarado Shannon K | -- | -- | |
| Alvarado Shannon K | -- | -- | |
| Alvarado Shannon K | $109,900 | -- |
Source: Public Records
Mortgage History
| Date | Status | Borrower | Loan Amount |
|---|---|---|---|
| Previous Owner | Alvarado Shannon K | $144,100 |
Source: Public Records
Tax History Compared to Growth
Tax History
| Year | Tax Paid | Tax Assessment Tax Assessment Total Assessment is a certain percentage of the fair market value that is determined by local assessors to be the total taxable value of land and additions on the property. | Land | Improvement |
|---|---|---|---|---|
| 2024 | $2,461 | $63,980 | $10,610 | $53,370 |
| 2023 | $2,461 | $63,980 | $10,610 | $53,370 |
| 2022 | $2,106 | $48,280 | $9,310 | $38,970 |
| 2021 | $2,106 | $48,280 | $9,310 | $38,970 |
| 2020 | $2,122 | $48,280 | $9,310 | $38,970 |
| 2019 | $1,928 | $42,720 | $8,900 | $33,820 |
| 2018 | $1,877 | $42,720 | $8,900 | $33,820 |
| 2017 | $1,795 | $42,721 | $8,897 | $33,824 |
| 2016 | $1,774 | $39,676 | $7,941 | $31,735 |
| 2015 | $836 | $39,676 | $7,941 | $31,735 |
| 2014 | $836 | $39,676 | $7,941 | $31,735 |
| 2013 | $836 | $39,676 | $7,941 | $31,735 |
| 2012 | $836 | $39,677 | $7,942 | $31,735 |
Source: Public Records
Map
Nearby Homes
- 22585 Defiance-Paulding County Line Rd
- 24220 County Road 196
- 14428 Singer Rd
- 2930 S State Route 66
- 15436 State Route 15
- 15196 State Route 15
- 16407 Ohio 15
- 2021 S Clinton St
- 2208 Riviera Rd
- 18228
- 14817 Road 171
- 15172 Dohoney Rd
- 0 Jasica Ct
- 14326 Road 171
- 1963 Sherwood Dr
- 786 Miami Dr
- Pattison Plan at Whispering Pines
- Pearson Plan at Whispering Pines
- Portsmouth Plan at Whispering Pines
- 1913 Sherwood Dr
- 22547 Def Paulding Co Line Rd
- 22607 Def Paulding Co Line Rd
- 22607 Def Paulding Co Line Rd
- 22472 Defiance-Paulding County Line Rd
- 22472 County Road 10
- 22685 Def Paulding Co Line Rd
- 22652 Def Paulding Co Line Rd
- 22652 County Road 10
- 22652 Rd 10
- 22652 Def-Pldg Co Line Rd 10
- 22652 Defiance-Paulding County Line Rd
- 22370 County Road 10
- 22585 Def Paulding Co Line Rd
- 22736 Def Paulding Co Line Rd
- 22736 County Road 10
- 22736 County Road 10
- 22805 Def Paulding Co Line Rd
- 15816 Williams Rd
- 15619 Campbell Rd
- 15980 Williams Rd