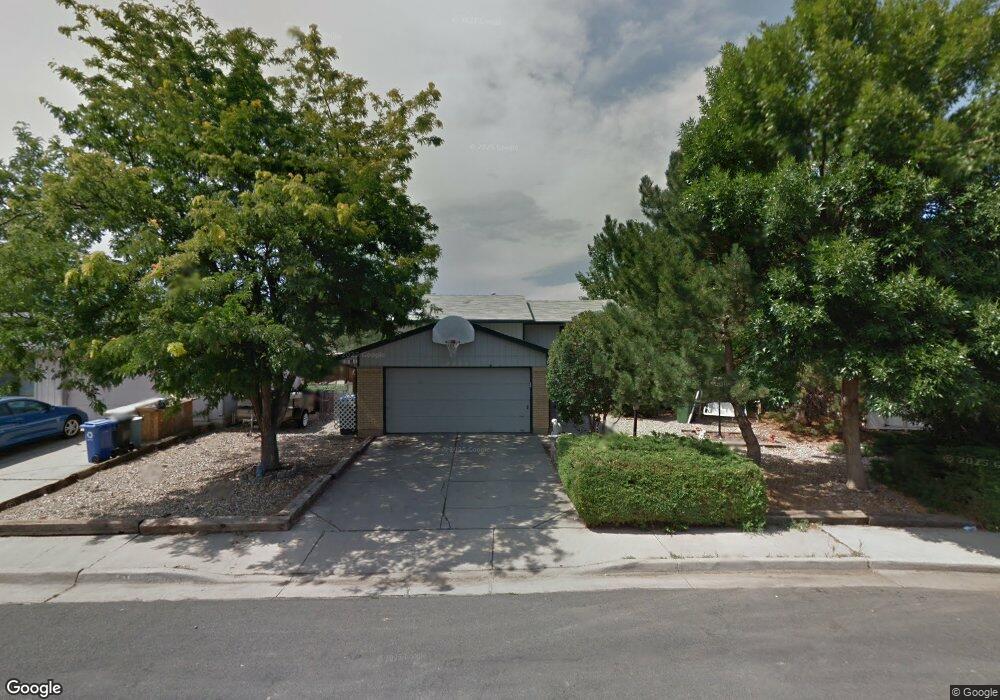
2253 6th St SW Loveland, CO 80537
Estimated Value: $450,626 - $480,000
3
Beds
2
Baths
1,730
Sq Ft
$268/Sq Ft
Est. Value
About This Home
This home is located at 2253 6th St SW, Loveland, CO 80537 and is currently estimated at $464,407, approximately $268 per square foot. 2253 6th St SW is a home located in Larimer County with nearby schools including Sarah Milner Elementary School, Walt Clark Middle School, and Thompson Valley High School.
Ownership History
Date
Name
Owned For
Owner Type
Purchase Details
Closed on
Jul 27, 2023
Sold by
Moreno Victoria S
Bought by
Moreno Victoria S and Moreno Vincent E
Current Estimated Value
Home Financials for this Owner
Home Financials are based on the most recent Mortgage that was taken out on this home.
Original Mortgage
$60,000
Outstanding Balance
$58,597
Interest Rate
6.67%
Mortgage Type
New Conventional
Estimated Equity
$405,810
Purchase Details
Closed on
Nov 19, 1997
Sold by
Boehm Victoria S
Bought by
Boehm Victoria S and Moreno Vincent E
Home Financials for this Owner
Home Financials are based on the most recent Mortgage that was taken out on this home.
Original Mortgage
$104,295
Interest Rate
7.23%
Mortgage Type
FHA
Purchase Details
Closed on
Dec 1, 1995
Sold by
Thoren Rebecca A
Bought by
Boehm Victoria S
Create a Home Valuation Report for This Property
The Home Valuation Report is an in-depth analysis detailing your home's value as well as a comparison with similar homes in the area
Home Values in the Area
Average Home Value in this Area
Purchase History
| Date | Buyer | Sale Price | Title Company |
|---|---|---|---|
| Moreno Victoria S | -- | None Listed On Document | |
| Boehm Victoria S | -- | -- | |
| Boehm Victoria S | $106,000 | -- |
Source: Public Records
Mortgage History
| Date | Status | Borrower | Loan Amount |
|---|---|---|---|
| Open | Moreno Victoria S | $60,000 | |
| Previous Owner | Boehm Victoria S | $104,295 |
Source: Public Records
Tax History Compared to Growth
Tax History
| Year | Tax Paid | Tax Assessment Tax Assessment Total Assessment is a certain percentage of the fair market value that is determined by local assessors to be the total taxable value of land and additions on the property. | Land | Improvement |
|---|---|---|---|---|
| 2025 | $2,148 | $30,599 | $2,479 | $28,120 |
| 2024 | $2,071 | $30,599 | $2,479 | $28,120 |
| 2022 | $1,791 | $22,512 | $2,572 | $19,940 |
| 2021 | $1,841 | $23,159 | $2,646 | $20,513 |
| 2020 | $1,868 | $23,495 | $2,646 | $20,849 |
| 2019 | $1,837 | $23,495 | $2,646 | $20,849 |
| 2018 | $1,554 | $18,886 | $2,664 | $16,222 |
| 2017 | $1,338 | $18,886 | $2,664 | $16,222 |
| 2016 | $1,124 | $15,331 | $2,945 | $12,386 |
| 2015 | $1,115 | $15,340 | $2,950 | $12,390 |
| 2014 | $975 | $12,970 | $2,390 | $10,580 |
Source: Public Records
Map
Nearby Homes
- 628 Jocelyn Dr
- 706 S Gilpin Ave
- 677 Gayla Ct
- 332 Terri Dr
- 1786 Wintergreen Place
- 432 Glenda Dr
- 2120 3rd St SW Unit 1
- 827 S Buckeye Dr
- 974 S Dotsero Dr
- 874 S Buckeye Dr
- 2123 Lily Dr
- 2503 10th St SW
- 796 S Tyler Ave
- 2583 Begonia Ct
- 2821 5th St SW
- 229 Blossom Dr
- 850 Gardenia Dr
- 825 Kaitlyn Cir
- 773 Johnson Ave
- 543 Dana Ct
- 2241 6th St SW
- 2265 6th St SW
- 2318 Alexis St
- 2330 Alexis St
- 2306 Alexis St
- 2229 6th St SW
- 2240 6th St SW
- 2252 6th St SW
- 515 S Empire Ave
- 2228 6th St SW
- 538 S Empire Ave
- 2217 6th St SW
- 2216 Iris Place
- 527 S Empire Ave
- 2354 Alexis St
- 2216 6th St SW
- 2307 Alexis St
- 605 S Empire Ave
- 526 S Empire Ave
- 2228 Iris Place