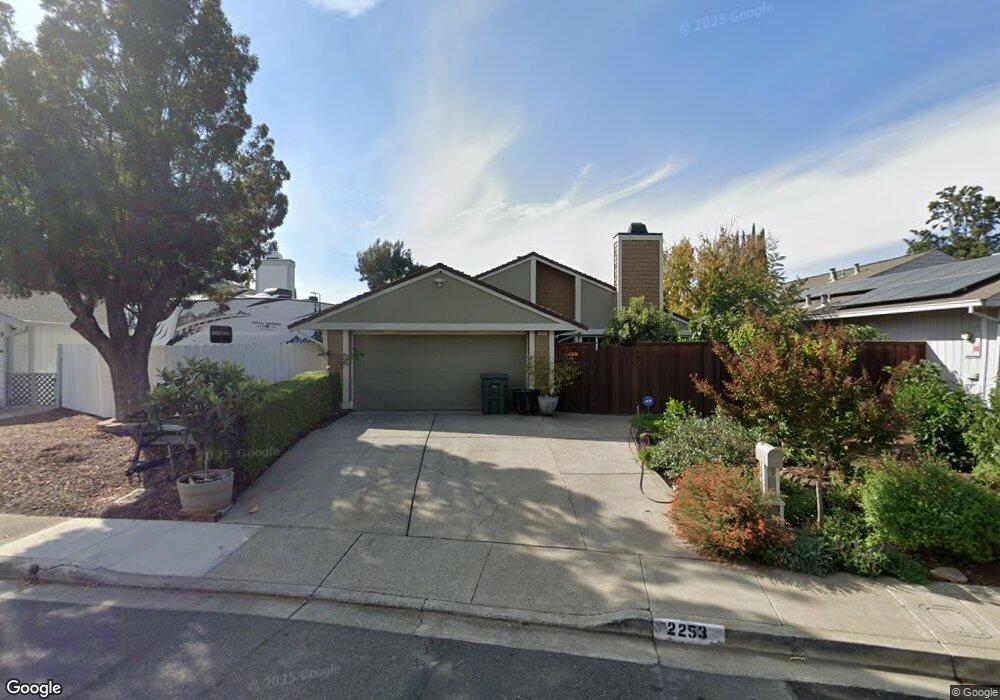
2253 Lynbrook Dr Pittsburg, CA 94565
Meadowbrook NeighborhoodEstimated Value: $554,026 - $653,000
4
Beds
2
Baths
1,518
Sq Ft
$387/Sq Ft
Est. Value
About This Home
This home is located at 2253 Lynbrook Dr, Pittsburg, CA 94565 and is currently estimated at $587,007, approximately $386 per square foot. 2253 Lynbrook Dr is a home located in Contra Costa County with nearby schools including Stoneman Elementary School, Hillview Junior High School, and Pittsburg Senior High School.
Ownership History
Date
Name
Owned For
Owner Type
Purchase Details
Closed on
Mar 24, 2003
Sold by
Gomez Martha E and Sahagun Luis H
Bought by
Gomez Martha E and Sahagun Luis E
Current Estimated Value
Home Financials for this Owner
Home Financials are based on the most recent Mortgage that was taken out on this home.
Original Mortgage
$177,000
Outstanding Balance
$75,536
Interest Rate
5.78%
Mortgage Type
Purchase Money Mortgage
Estimated Equity
$511,471
Purchase Details
Closed on
Jan 26, 1999
Sold by
Freitas Gregg A
Bought by
Gomez Martha E and Sahagun Luis E
Home Financials for this Owner
Home Financials are based on the most recent Mortgage that was taken out on this home.
Original Mortgage
$147,086
Interest Rate
6.63%
Mortgage Type
FHA
Purchase Details
Closed on
Jun 23, 1997
Sold by
Fortes Elizabeth L
Bought by
Freitas Gregg A
Purchase Details
Closed on
Nov 16, 1995
Sold by
Arenas Floralba and Morales Alba Lucia
Bought by
Freitas Gregg A and Fortes Elizabeth L
Home Financials for this Owner
Home Financials are based on the most recent Mortgage that was taken out on this home.
Original Mortgage
$123,213
Interest Rate
7.51%
Mortgage Type
FHA
Create a Home Valuation Report for This Property
The Home Valuation Report is an in-depth analysis detailing your home's value as well as a comparison with similar homes in the area
Home Values in the Area
Average Home Value in this Area
Purchase History
| Date | Buyer | Sale Price | Title Company |
|---|---|---|---|
| Gomez Martha E | $177,000 | Alliance Title Company | |
| Gomez Martha E | $149,000 | North American Title Co | |
| Freitas Gregg A | -- | -- | |
| Freitas Gregg A | $124,000 | North American Title Co |
Source: Public Records
Mortgage History
| Date | Status | Borrower | Loan Amount |
|---|---|---|---|
| Open | Gomez Martha E | $177,000 | |
| Closed | Gomez Martha E | $147,086 | |
| Previous Owner | Freitas Gregg A | $123,213 |
Source: Public Records
Tax History Compared to Growth
Tax History
| Year | Tax Paid | Tax Assessment Tax Assessment Total Assessment is a certain percentage of the fair market value that is determined by local assessors to be the total taxable value of land and additions on the property. | Land | Improvement |
|---|---|---|---|---|
| 2025 | $3,847 | $300,470 | $104,514 | $195,956 |
| 2024 | $3,894 | $294,579 | $102,465 | $192,114 |
| 2023 | $3,894 | $288,804 | $100,456 | $188,348 |
| 2022 | $3,946 | $283,142 | $98,487 | $184,655 |
| 2021 | $3,941 | $277,591 | $96,556 | $181,035 |
| 2019 | $3,753 | $269,359 | $93,693 | $175,666 |
| 2018 | $3,611 | $264,078 | $91,856 | $172,222 |
| 2017 | $3,583 | $258,901 | $90,055 | $168,846 |
| 2016 | $3,335 | $253,826 | $88,290 | $165,536 |
| 2015 | $3,477 | $250,014 | $86,964 | $163,050 |
| 2014 | $2,910 | $206,500 | $71,828 | $134,672 |
Source: Public Records
Map
Nearby Homes
- 2251 Lynbrook Dr
- 2255 Lynbrook Dr
- 2249 Lynbrook Dr
- 2257 Lynbrook Dr
- 2244 Fairbourne Dr
- 2245 Lynbrook Dr
- 2259 Lynbrook Dr
- 2242 Fairbourne Dr
- 2243 Lynbrook Dr
- 2250 Lynbrook Dr
- 2261 Lynbrook Dr
- 2254 Lynbrook Dr
- 2240 Lynbrook Dr
- 2241 Lynbrook Dr
- 2240 Fairbourne Dr
- 2256 Lynbrook Dr
- 2263 Lynbrook Dr
- 128 Banyon Dr
- 84 Hilo Dr
- 126 Banyon Dr