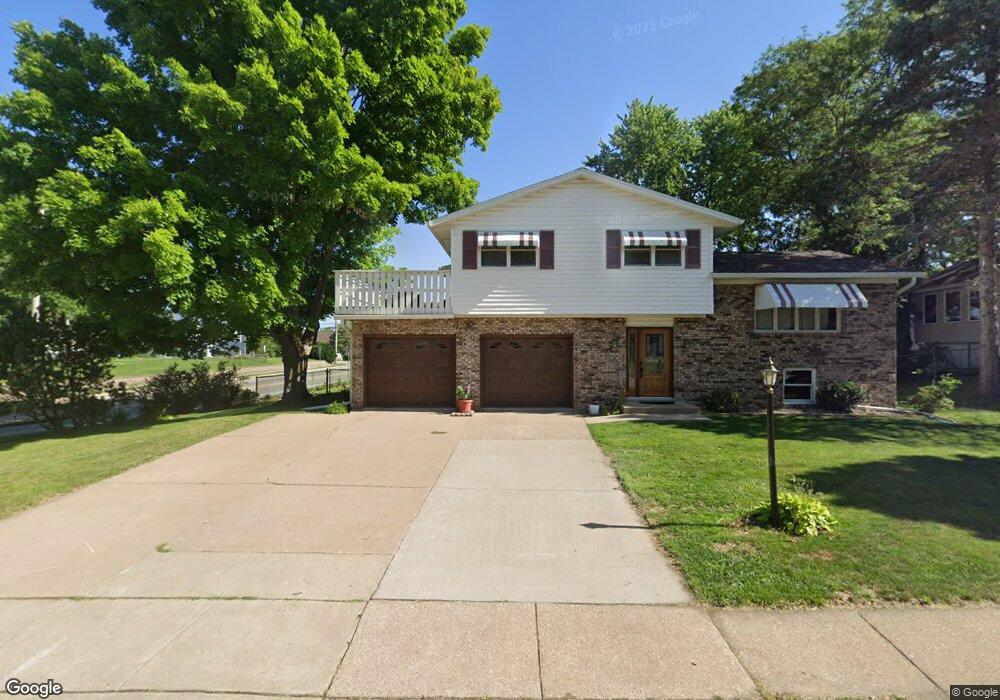
2254 W 45th St Davenport, IA 52806
North Side NeighborhoodEstimated Value: $239,882 - $274,000
3
Beds
2
Baths
2,640
Sq Ft
$96/Sq Ft
Est. Value
About This Home
This home is located at 2254 W 45th St, Davenport, IA 52806 and is currently estimated at $254,721, approximately $96 per square foot. 2254 W 45th St is a home located in Scott County with nearby schools including Martin Luther King Jr. Elementary School, Buchanan Elementary School, and Cumberland Hall School.
Ownership History
Date
Name
Owned For
Owner Type
Purchase Details
Closed on
Feb 20, 2024
Sold by
Lakey Lori A
Bought by
Marley James
Current Estimated Value
Home Financials for this Owner
Home Financials are based on the most recent Mortgage that was taken out on this home.
Original Mortgage
$240,222
Outstanding Balance
$235,766
Interest Rate
6.64%
Mortgage Type
VA
Estimated Equity
$18,955
Purchase Details
Closed on
Jan 31, 2024
Sold by
Irhc Llc
Bought by
Birchwood Grove Llc
Home Financials for this Owner
Home Financials are based on the most recent Mortgage that was taken out on this home.
Original Mortgage
$240,222
Outstanding Balance
$235,766
Interest Rate
6.64%
Mortgage Type
VA
Estimated Equity
$18,955
Purchase Details
Closed on
Jan 11, 2024
Sold by
Aspen Homes Llc
Bought by
Townsend Patrick and Townsend Lorie
Home Financials for this Owner
Home Financials are based on the most recent Mortgage that was taken out on this home.
Original Mortgage
$240,222
Outstanding Balance
$235,766
Interest Rate
6.64%
Mortgage Type
VA
Estimated Equity
$18,955
Purchase Details
Closed on
Dec 29, 2023
Sold by
Langwith Alford L
Bought by
Langwith Dennis and Langwith Susan
Home Financials for this Owner
Home Financials are based on the most recent Mortgage that was taken out on this home.
Original Mortgage
$240,222
Outstanding Balance
$235,766
Interest Rate
6.64%
Mortgage Type
VA
Estimated Equity
$18,955
Purchase Details
Closed on
Mar 30, 2012
Sold by
Lakey James T and Lakey Lori A
Bought by
Lakey Lori A
Create a Home Valuation Report for This Property
The Home Valuation Report is an in-depth analysis detailing your home's value as well as a comparison with similar homes in the area
Home Values in the Area
Average Home Value in this Area
Purchase History
| Date | Buyer | Sale Price | Title Company |
|---|---|---|---|
| Marley James | $235,500 | None Listed On Document | |
| Birchwood Grove Llc | $1,700,000 | None Listed On Document | |
| Townsend Patrick | $429,500 | None Listed On Document | |
| Langwith Dennis | -- | None Listed On Document | |
| Lakey Lori A | -- | None Available |
Source: Public Records
Mortgage History
| Date | Status | Borrower | Loan Amount |
|---|---|---|---|
| Open | Marley James | $240,222 |
Source: Public Records
Tax History Compared to Growth
Tax History
| Year | Tax Paid | Tax Assessment Tax Assessment Total Assessment is a certain percentage of the fair market value that is determined by local assessors to be the total taxable value of land and additions on the property. | Land | Improvement |
|---|---|---|---|---|
| 2025 | $3,764 | $249,940 | $38,730 | $211,210 |
| 2024 | $3,376 | $220,810 | $38,730 | $182,080 |
| 2023 | $3,582 | $212,700 | $38,730 | $173,970 |
| 2022 | $3,596 | $179,930 | $34,650 | $145,280 |
| 2021 | $3,596 | $179,930 | $34,650 | $145,280 |
| 2020 | $3,474 | $175,890 | $34,650 | $141,240 |
| 2019 | $3,290 | $158,370 | $34,650 | $123,720 |
| 2018 | $3,214 | $158,370 | $34,650 | $123,720 |
| 2017 | $3,334 | $158,370 | $34,650 | $123,720 |
| 2016 | $3,204 | $158,370 | $0 | $0 |
| 2015 | $3,204 | $157,430 | $0 | $0 |
| 2014 | $3,230 | $157,430 | $0 | $0 |
| 2013 | $3,168 | $0 | $0 | $0 |
| 2012 | -- | $146,520 | $32,820 | $113,700 |
Source: Public Records
Map
Nearby Homes
- 4406 Regency Place
- 2426 W 44th St
- 28 W Village Cir
- 4123 N Linwood Ave
- 4104 N Linwood Ave
- 2127 W 51st St
- 5109 N Pine St
- 4132 Rodeo Rd
- 2724 W 38th Place
- 2728 W 38th Place
- 3812 N Thornwood Ave
- 3812 Joyce Ln
- 4036 Hillandale Rd
- 5210 N Division St
- 4705 N Sturdevant St
- 3208 W 47th Place
- 5312 Hillandale Rd
- 1729 Welshire Dr
- 4849 Oakwood Ct
- 3325 Covington Dr