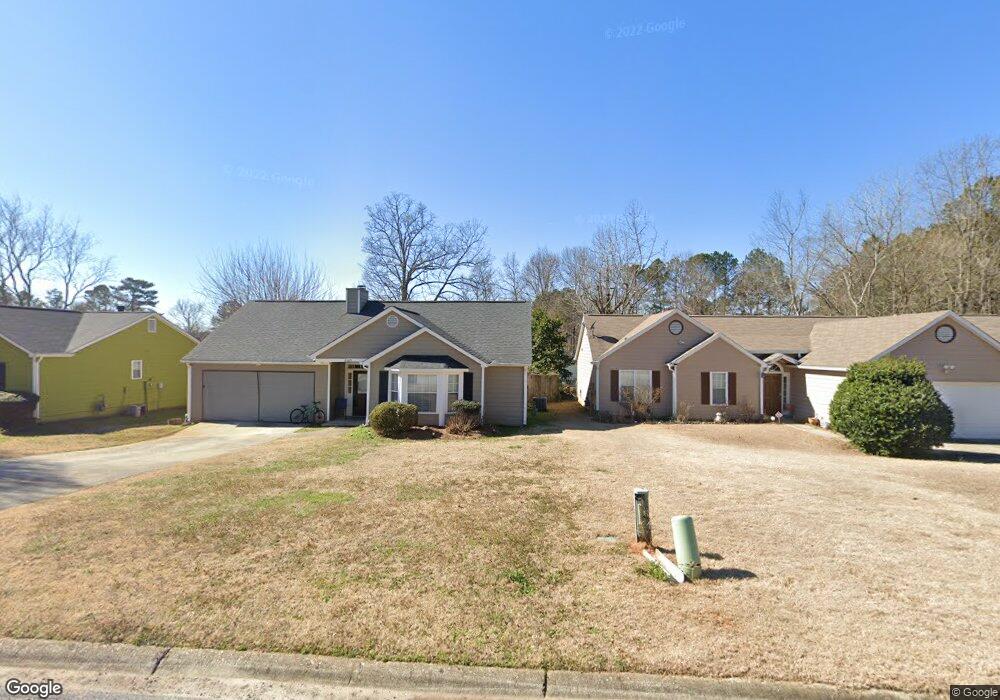
2255 Boone Ct Unit 1 Snellville, GA 30078
Estimated Value: $289,000 - $319,000
3
Beds
2
Baths
1,468
Sq Ft
$205/Sq Ft
Est. Value
About This Home
This home is located at 2255 Boone Ct Unit 1, Snellville, GA 30078 and is currently estimated at $300,920, approximately $204 per square foot. 2255 Boone Ct Unit 1 is a home located in Gwinnett County with nearby schools including Norton Elementary School, Snellville Middle School, and South Gwinnett High School.
Ownership History
Date
Name
Owned For
Owner Type
Purchase Details
Closed on
Dec 28, 2004
Sold by
Smith Veneetia
Bought by
Kolasinac Safet and Kolasinac Sanela
Current Estimated Value
Home Financials for this Owner
Home Financials are based on the most recent Mortgage that was taken out on this home.
Original Mortgage
$128,976
Outstanding Balance
$63,848
Interest Rate
5.66%
Mortgage Type
VA
Estimated Equity
$237,072
Purchase Details
Closed on
Jun 5, 2000
Sold by
Wynter Donald
Bought by
Smith Veneetia
Home Financials for this Owner
Home Financials are based on the most recent Mortgage that was taken out on this home.
Original Mortgage
$106,500
Interest Rate
8.63%
Mortgage Type
New Conventional
Purchase Details
Closed on
Jul 9, 1999
Sold by
Stephens Stephen B and Stephens Virginia M
Bought by
Wynter Donald
Home Financials for this Owner
Home Financials are based on the most recent Mortgage that was taken out on this home.
Original Mortgage
$81,600
Interest Rate
9.99%
Mortgage Type
New Conventional
Create a Home Valuation Report for This Property
The Home Valuation Report is an in-depth analysis detailing your home's value as well as a comparison with similar homes in the area
Home Values in the Area
Average Home Value in this Area
Purchase History
| Date | Buyer | Sale Price | Title Company |
|---|---|---|---|
| Kolasinac Safet | $131,000 | -- | |
| Smith Veneetia | $106,500 | -- | |
| Wynter Donald | $96,000 | -- |
Source: Public Records
Mortgage History
| Date | Status | Borrower | Loan Amount |
|---|---|---|---|
| Open | Kolasinac Safet | $128,976 | |
| Previous Owner | Smith Veneetia | $106,500 | |
| Previous Owner | Wynter Donald | $81,600 |
Source: Public Records
Tax History Compared to Growth
Tax History
| Year | Tax Paid | Tax Assessment Tax Assessment Total Assessment is a certain percentage of the fair market value that is determined by local assessors to be the total taxable value of land and additions on the property. | Land | Improvement |
|---|---|---|---|---|
| 2025 | $2,987 | $109,160 | $18,000 | $91,160 |
| 2024 | $3,082 | $108,120 | $18,000 | $90,120 |
| 2023 | $3,082 | $116,200 | $27,080 | $89,120 |
| 2022 | $2,487 | $81,440 | $19,200 | $62,240 |
| 2021 | $2,261 | $69,040 | $14,000 | $55,040 |
| 2020 | $2,128 | $62,240 | $13,200 | $49,040 |
| 2019 | $1,980 | $58,000 | $12,000 | $46,000 |
| 2018 | $1,910 | $54,920 | $12,000 | $42,920 |
| 2016 | $1,704 | $46,120 | $8,000 | $38,120 |
| 2015 | $1,289 | $33,920 | $6,400 | $27,520 |
| 2014 | -- | $33,920 | $6,400 | $27,520 |
Source: Public Records
Map
Nearby Homes
- 2325 Thackery Rd
- 3487 Desoto Rd
- 2296 Thackery Rd
- 3430 Park Glenn Ln
- 3265 Brownwood Dr
- 2495 Rosedale Rd
- 2500 Rosedale Rd Unit I
- 2459 Jacks View Ct
- 2404 Jacks View Ct Unit 2
- 2034 Britt Dr
- 2563 Creek Terrace
- 3477 Chinaberry Ln
- 2167 Foley Park St
- 2546 Tullamore Cir
- 3480 Eastpines Way
- 3045 Wildflower Ln
- 2350 Action Way
- 2312 Westridge Dr
- 2430 Bankston Cir
- 2101 Bankston Cir
- 2245 Boone Ct
- 2265 Boone Ct
- 2275 Boone Ct
- 2260 Boone Place
- 2270 Boone Place Unit 1
- 2235 Boone Ct Unit 1
- 2285 Boone Ct
- 2254 Boone Ct
- 0 Boone Course Unit 8485596
- 0 Boone Course
- 2264 Boone Ct
- 2225 Boone Ct Unit I
- 2234 Boone Ct
- 2250 Boone Place Unit 1
- 2215 Boone Ct
- 2244 Boone Ct
- 2274 Boone Ct Unit 1
- 2280 Boone Place
- 2224 Boone Ct
- 2224 Boone Ct Unit 1