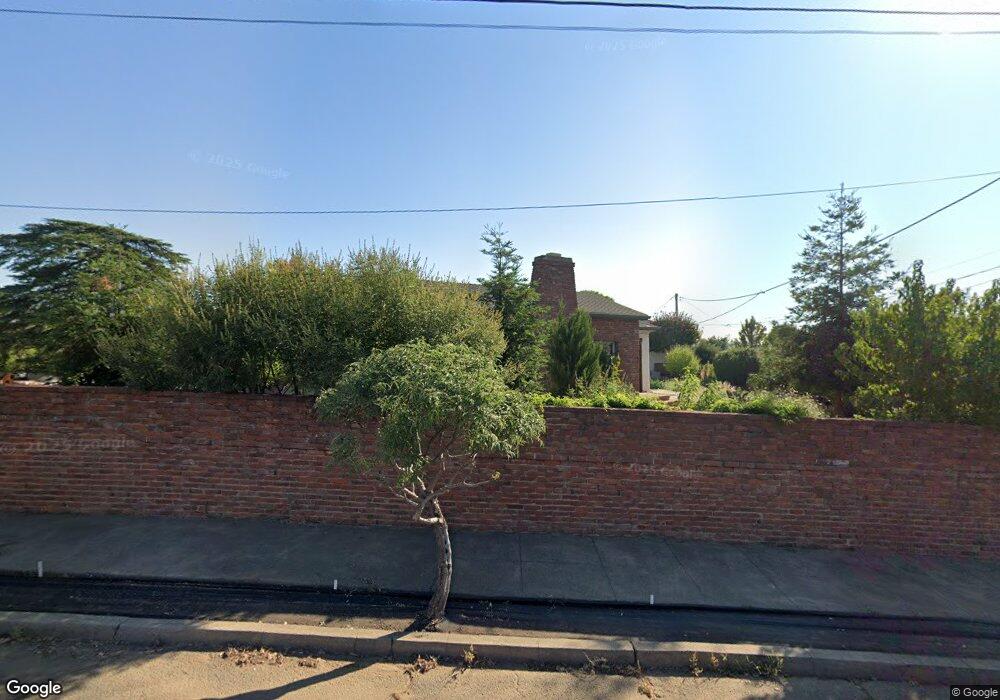
2255 Crestview Ave Redding, CA 96001
Greenwood NeighborhoodEstimated Value: $245,000 - $457,720
4
Beds
3
Baths
2,636
Sq Ft
$135/Sq Ft
Est. Value
About This Home
This home is located at 2255 Crestview Ave, Redding, CA 96001 and is currently estimated at $355,930, approximately $135 per square foot. 2255 Crestview Ave is a home located in Shasta County with nearby schools including Cypress Elementary School, Sequoia Middle School, and Shasta High School.
Ownership History
Date
Name
Owned For
Owner Type
Purchase Details
Closed on
Dec 24, 2015
Sold by
Podtetenieff Eric
Bought by
Podtetenieff Eric
Current Estimated Value
Home Financials for this Owner
Home Financials are based on the most recent Mortgage that was taken out on this home.
Original Mortgage
$200,800
Outstanding Balance
$159,168
Interest Rate
3.94%
Mortgage Type
Credit Line Revolving
Estimated Equity
$196,762
Purchase Details
Closed on
Mar 21, 2012
Sold by
Podtetenieff Kristen
Bought by
Podtetenieff Eric
Home Financials for this Owner
Home Financials are based on the most recent Mortgage that was taken out on this home.
Original Mortgage
$80,000
Interest Rate
3.83%
Mortgage Type
Seller Take Back
Purchase Details
Closed on
Dec 16, 2009
Sold by
Sharrett Linda
Bought by
Sharrett Linda D
Purchase Details
Closed on
Jan 20, 2008
Sold by
Morrison William E
Bought by
Sharrett Linda
Purchase Details
Closed on
Mar 30, 2000
Sold by
Morrison William E
Bought by
Morrison William E
Create a Home Valuation Report for This Property
The Home Valuation Report is an in-depth analysis detailing your home's value as well as a comparison with similar homes in the area
Home Values in the Area
Average Home Value in this Area
Purchase History
| Date | Buyer | Sale Price | Title Company |
|---|---|---|---|
| Podtetenieff Eric | -- | First American Title Company | |
| Podtetenieff Eric | -- | Placer Title Company | |
| Podtetenieff Eric | $80,000 | Placer Title Company | |
| Sharrett Linda D | -- | None Available | |
| Sharrett Linda | -- | None Available | |
| Morrison William E | -- | -- |
Source: Public Records
Mortgage History
| Date | Status | Borrower | Loan Amount |
|---|---|---|---|
| Open | Podtetenieff Eric | $200,800 | |
| Closed | Podtetenieff Eric | $80,000 |
Source: Public Records
Tax History
| Year | Tax Paid | Tax Assessment Tax Assessment Total Assessment is a certain percentage of the fair market value that is determined by local assessors to be the total taxable value of land and additions on the property. | Land | Improvement |
|---|---|---|---|---|
| 2025 | $1,084 | $100,474 | $43,956 | $56,518 |
| 2024 | $1,067 | $98,505 | $43,095 | $55,410 |
| 2023 | $1,067 | $96,574 | $42,250 | $54,324 |
| 2022 | $1,049 | $94,681 | $41,422 | $53,259 |
| 2021 | $1,043 | $92,825 | $40,610 | $52,215 |
| 2020 | $1,056 | $91,874 | $40,194 | $51,680 |
| 2019 | $1,004 | $90,073 | $39,406 | $50,667 |
| 2018 | $1,013 | $88,308 | $38,634 | $49,674 |
| 2017 | $1,007 | $86,577 | $37,877 | $48,700 |
| 2016 | $976 | $84,881 | $37,135 | $47,746 |
| 2015 | $964 | $83,607 | $36,578 | $47,029 |
| 2014 | $986 | $84,590 | $35,862 | $48,728 |
Source: Public Records
Map
Nearby Homes
- 2077 Skyline Dr
- 1868 Gold St
- 3024 West St
- 2381/2401 West St
- 2330 West St
- 1777 Magnolia Ave
- 2514 California St
- 2036 Placer St
- 0 California St Unit 25-5331
- 1545 Olive Ave
- 1012 State St
- 2327 Butte St
- 2315 Butte St
- 1377 Willis St
- 864 Kite Ln
- 3244 Veda St
- 2907 Pawnee Ct
- 1005 Gold St
- 815 Locust St
- 745 Parkview Ave
- 2239 Crestview Ave
- 2230 Vista Ave
- 2268 Vista Ave
- 2161 Octavia St
- 2249 Octavia St
- 2283 Octavia St
- 0 Octavia St
- 2053 Octavia St
- 2065 Octavia St
- 2254 Crestview Ave
- 2264 Crestview Ave
- 2220 Vista Ave
- 2244 Crestview Ave
- 2231 Crestview Ave
- 2234 Crestview Ave
- 2221 Crestview Ave
- 2208 Vista Ave
- 2225 Vista Ave
- 2224 Crestview Ave
- 2233 Vista Ave
Your Personal Tour Guide
Ask me questions while you tour the home.