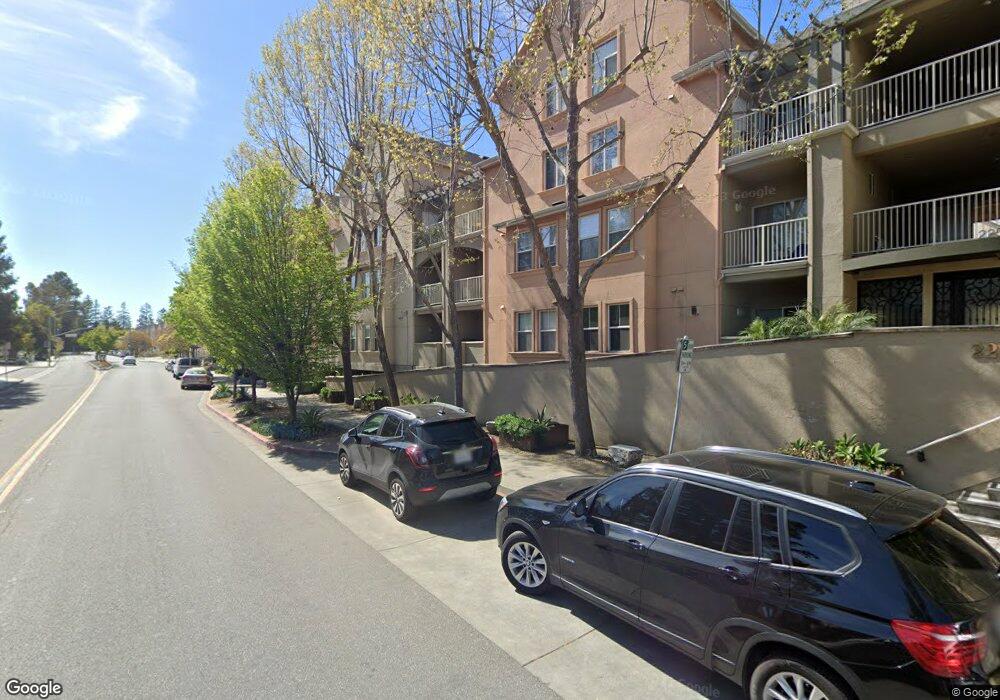
Parc Crossings 2255 Showers Dr Unit 333 Mountain View, CA 94040
Mountain View West NeighborhoodEstimated Value: $1,003,006 - $1,201,000
2
Beds
2
Baths
1,213
Sq Ft
$914/Sq Ft
Est. Value
About This Home
This home is located at 2255 Showers Dr Unit 333, Mountain View, CA 94040 and is currently estimated at $1,108,752, approximately $914 per square foot. 2255 Showers Dr Unit 333 is a home located in Santa Clara County with nearby schools including Covington Elementary School, Ardis G. Egan Junior High School, and Los Altos High School.
Ownership History
Date
Name
Owned For
Owner Type
Purchase Details
Closed on
Jul 19, 2011
Sold by
Sun Rongchun and Gao Halyan
Bought by
Yin Shong
Current Estimated Value
Home Financials for this Owner
Home Financials are based on the most recent Mortgage that was taken out on this home.
Original Mortgage
$325,000
Outstanding Balance
$223,062
Interest Rate
4.46%
Mortgage Type
New Conventional
Estimated Equity
$885,690
Purchase Details
Closed on
Jul 14, 2011
Sold by
Sun Rongchun and Gao Halyan
Bought by
Yin Shong
Home Financials for this Owner
Home Financials are based on the most recent Mortgage that was taken out on this home.
Original Mortgage
$325,000
Outstanding Balance
$223,062
Interest Rate
4.46%
Mortgage Type
New Conventional
Estimated Equity
$885,690
Purchase Details
Closed on
Dec 3, 1998
Sold by
Northe Development Llc
Bought by
Sun Rongchun and Gao Haiyan
Home Financials for this Owner
Home Financials are based on the most recent Mortgage that was taken out on this home.
Original Mortgage
$239,950
Interest Rate
6.87%
Create a Home Valuation Report for This Property
The Home Valuation Report is an in-depth analysis detailing your home's value as well as a comparison with similar homes in the area
Home Values in the Area
Average Home Value in this Area
Purchase History
| Date | Buyer | Sale Price | Title Company |
|---|---|---|---|
| Yin Shong | $525,000 | Chicago Title Company | |
| Yin Shong | $525,000 | Chicago Title Company | |
| Sun Rongchun | $300,000 | Fidelity National Title Co |
Source: Public Records
Mortgage History
| Date | Status | Borrower | Loan Amount |
|---|---|---|---|
| Open | Yin Shong | $325,000 | |
| Closed | Yin Shong | $325,000 | |
| Previous Owner | Sun Rongchun | $239,950 |
Source: Public Records
Tax History Compared to Growth
Tax History
| Year | Tax Paid | Tax Assessment Tax Assessment Total Assessment is a certain percentage of the fair market value that is determined by local assessors to be the total taxable value of land and additions on the property. | Land | Improvement |
|---|---|---|---|---|
| 2025 | $8,303 | $659,416 | $217,541 | $441,875 |
| 2024 | $8,303 | $646,487 | $213,276 | $433,211 |
| 2023 | $8,147 | $633,812 | $209,095 | $424,717 |
| 2022 | $8,088 | $621,386 | $204,996 | $416,390 |
| 2021 | $8,129 | $609,203 | $200,977 | $408,226 |
| 2020 | $8,189 | $602,958 | $198,917 | $404,041 |
| 2019 | $7,821 | $591,136 | $195,017 | $396,119 |
| 2018 | $7,753 | $579,546 | $191,194 | $388,352 |
| 2017 | $7,481 | $568,184 | $187,446 | $380,738 |
| 2016 | $7,287 | $557,044 | $183,771 | $373,273 |
| 2015 | $7,187 | $548,678 | $181,011 | $367,667 |
| 2014 | $7,034 | $537,931 | $177,466 | $360,465 |
Source: Public Records
About Parc Crossings
Map
Nearby Homes
- 181 Del Medio Ave Unit 307
- 103 Whits Rd
- 2483 Whitney Dr
- 49 Showers Dr Unit J317
- 49 Showers Dr Unit D460
- 49 Showers Dr
- 49 Showers Dr Unit E151
- 432 Victory Ave
- 2375 Adele Ave
- 278 Monroe Dr Unit 17
- 2474 Alvin St
- 280 College Ave
- 4148 Byron St
- 3003 Marcelli Cir
- 2524 W Middlefield Rd Unit 2
- 37 Los Altos Square
- 298 S Rengstorff Ave
- 64 Los Altos Square
- 4225 Park Blvd
- 1023 Mercedes Ave
- 2255 Showers Dr
- 2255 Showers Dr Unit 325
- 2255 Showers Dr Unit 281
- 2255 Showers Dr Unit 381
- 2255 Showers Dr
- 2255 Showers Dr Unit 332
- 2255 Showers Dr Unit 331
- 2255 Showers Dr Unit 325
- 2255 Showers Dr Unit 324
- 2255 Showers Dr Unit 323
- 2255 Showers Dr Unit 322
- 2255 Showers Dr Unit 321
- 2255 Showers Dr Unit 314
- 2255 Showers Dr Unit 313
- 2255 Showers Dr Unit 312
- 2255 Showers Dr Unit 311
- 2255 Showers Dr Unit 297
- 2255 Showers Dr Unit 296
- 2255 Showers Dr Unit 295
- 2255 Showers Dr Unit 181