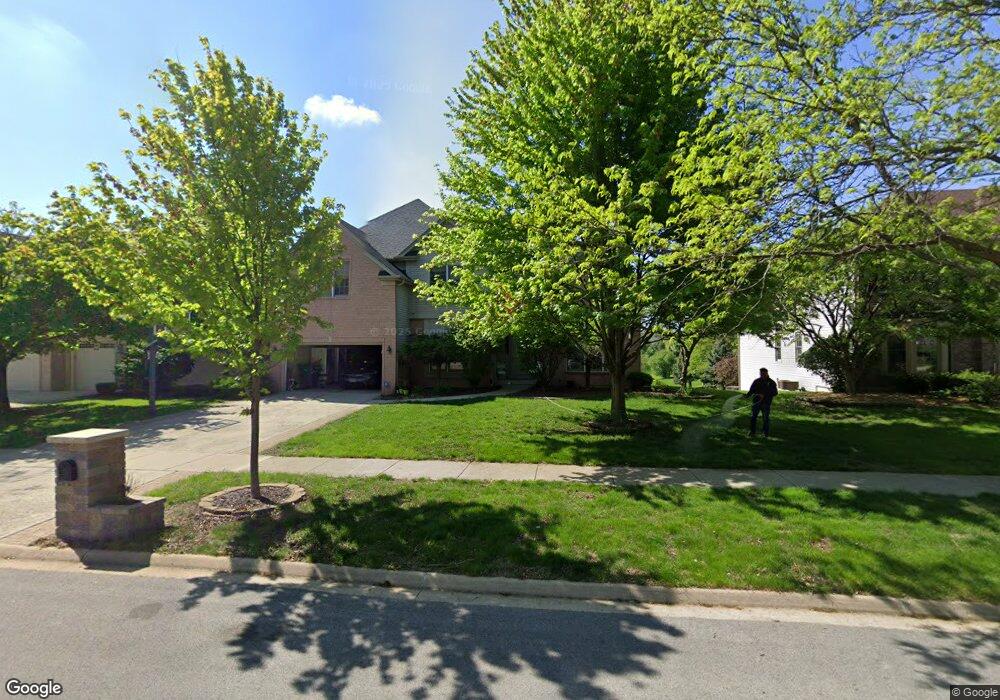
22561 Deer Path Ln Plainfield, IL 60544
West Bolingbrook NeighborhoodEstimated Value: $615,145 - $687,000
5
Beds
4
Baths
3,576
Sq Ft
$179/Sq Ft
Est. Value
About This Home
This home is located at 22561 Deer Path Ln, Plainfield, IL 60544 and is currently estimated at $640,286, approximately $179 per square foot. 22561 Deer Path Ln is a home located in Will County with nearby schools including Elizabeth Eichelberger Elementary School, John F Kennedy Middle School, and Plainfield East High School.
Ownership History
Date
Name
Owned For
Owner Type
Purchase Details
Closed on
Jul 11, 2012
Sold by
Khan Arif Aziz and Khan Samia
Bought by
Khan Arif Aziz and Khan Samia
Current Estimated Value
Purchase Details
Closed on
Mar 26, 2010
Sold by
Pyzalski Christopher and Pyzalski Maria
Bought by
Khan Arif and Khan Samia
Purchase Details
Closed on
Jan 27, 2004
Sold by
Gladstone Builders & Developers Inc
Bought by
Pyzalski Christopher and Pyzalski Maria
Home Financials for this Owner
Home Financials are based on the most recent Mortgage that was taken out on this home.
Original Mortgage
$413,300
Interest Rate
5.37%
Mortgage Type
Purchase Money Mortgage
Create a Home Valuation Report for This Property
The Home Valuation Report is an in-depth analysis detailing your home's value as well as a comparison with similar homes in the area
Home Values in the Area
Average Home Value in this Area
Purchase History
| Date | Buyer | Sale Price | Title Company |
|---|---|---|---|
| Khan Arif Aziz | -- | None Available | |
| Khan Arif | $404,500 | Law Title Insurance | |
| Pyzalski Christopher | $517,500 | Chicago Title Insurance Co |
Source: Public Records
Mortgage History
| Date | Status | Borrower | Loan Amount |
|---|---|---|---|
| Previous Owner | Pyzalski Christopher | $413,300 |
Source: Public Records
Tax History
| Year | Tax Paid | Tax Assessment Tax Assessment Total Assessment is a certain percentage of the fair market value that is determined by local assessors to be the total taxable value of land and additions on the property. | Land | Improvement |
|---|---|---|---|---|
| 2024 | $12,489 | $177,405 | $33,998 | $143,407 |
| 2023 | $12,489 | $160,228 | $30,706 | $129,522 |
| 2022 | $11,968 | $153,686 | $29,452 | $124,234 |
| 2021 | $11,331 | $143,632 | $27,525 | $116,107 |
| 2020 | $12,918 | $160,410 | $30,740 | $129,670 |
| 2019 | $12,472 | $152,844 | $29,290 | $123,554 |
| 2018 | $12,658 | $152,020 | $29,689 | $122,331 |
| 2017 | $12,278 | $144,464 | $28,213 | $116,251 |
| 2016 | $11,987 | $137,782 | $26,908 | $110,874 |
| 2015 | $11,357 | $129,070 | $25,207 | $103,863 |
| 2014 | $11,357 | $124,513 | $24,317 | $100,196 |
| 2013 | $11,357 | $124,513 | $24,317 | $100,196 |
Source: Public Records
Map
Nearby Homes
- 13910 Cambridge Cir
- 22718 Bass Lake Rd
- 23118 Lacroix Ln
- 22201 W Ocala Ct
- 22743 Marina Dr
- 22245 W Natchez Ct
- 13138 Lake Mary Dr
- 22252 W Taylor Rd
- 13202 Lakepoint Dr
- 2084 Kentland Dr
- 23406 W 135th St
- 13752 Capista Dr Unit 2
- 21854 W Kentwood Dr
- 23217 W Tenny St
- 23201 W Kennebec Dr
- 23231 W Tenny St
- 14153 S Longview Ln
- 23253 W Tenny St
- 23236 W Tenny St
- 13026 S Slate Ln
- 22601 Deer Path Ln
- 22555 Deer Path Ln
- 22549 Deer Path Ln
- 22607 Deer Path Ln
- 13721 Hunt Club Ln
- 22560 Deer Path Ln
- 22600 Deer Path Ln
- 22554 Deer Path Ln
- 22543 Deer Path Ln
- 22606 Deer Path Ln
- 13727 Hunt Club Ln
- 22548 Deer Path Ln
- 22612 Deer Path Ln
- 13733 Hunt Club Ln
- 22537 Deer Path Ln
- 13710 Hunt Club Ln
- 22542 Deer Path Ln
- 13716 Hunt Club Ln
- 22618 Deer Path Ln
- 13722 Hunt Club Ln
Your Personal Tour Guide
Ask me questions while you tour the home.