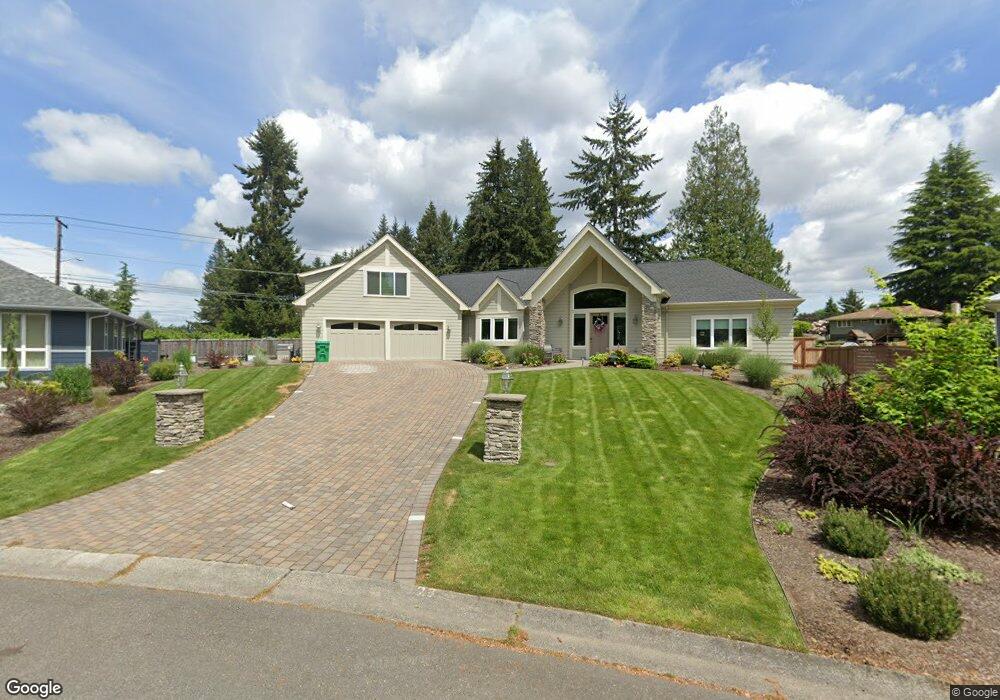
2257 Nut Tree Loop SE Olympia, WA 98501
Cain Road NeighborhoodEstimated Value: $1,063,000 - $1,253,116
4
Beds
5
Baths
3,134
Sq Ft
$375/Sq Ft
Est. Value
About This Home
This home is located at 2257 Nut Tree Loop SE, Olympia, WA 98501 and is currently estimated at $1,176,779, approximately $375 per square foot. 2257 Nut Tree Loop SE is a home with nearby schools including Pioneer Elementary School, Washington Middle School, and Olympia High School.
Ownership History
Date
Name
Owned For
Owner Type
Purchase Details
Closed on
Sep 5, 2019
Sold by
Hull Marvin and Hull Gale
Bought by
Hull Marvin R and Hull Gale D
Current Estimated Value
Home Financials for this Owner
Home Financials are based on the most recent Mortgage that was taken out on this home.
Original Mortgage
$688,000
Outstanding Balance
$598,229
Interest Rate
3.25%
Mortgage Type
Adjustable Rate Mortgage/ARM
Estimated Equity
$578,550
Purchase Details
Closed on
Jan 16, 2018
Sold by
Buehler Dan and Buehler Carol
Bought by
Hull Marvin and Hull Gale
Purchase Details
Closed on
Apr 5, 1996
Sold by
Meeks Ira Preston and Meeks Linda D
Bought by
The First National Bank Of Chicago
Home Financials for this Owner
Home Financials are based on the most recent Mortgage that was taken out on this home.
Original Mortgage
$450,000
Interest Rate
7.41%
Mortgage Type
Seller Take Back
Create a Home Valuation Report for This Property
The Home Valuation Report is an in-depth analysis detailing your home's value as well as a comparison with similar homes in the area
Home Values in the Area
Average Home Value in this Area
Purchase History
| Date | Buyer | Sale Price | Title Company |
|---|---|---|---|
| Hull Marvin R | -- | Thurston County Title Co | |
| Hull Marvin | $174,509 | Thurston County Title Co | |
| The First National Bank Of Chicago | $530,680 | Thurston County Title Co |
Source: Public Records
Mortgage History
| Date | Status | Borrower | Loan Amount |
|---|---|---|---|
| Open | Hull Marvin R | $688,000 | |
| Previous Owner | The First National Bank Of Chicago | $450,000 |
Source: Public Records
Tax History Compared to Growth
Tax History
| Year | Tax Paid | Tax Assessment Tax Assessment Total Assessment is a certain percentage of the fair market value that is determined by local assessors to be the total taxable value of land and additions on the property. | Land | Improvement |
|---|---|---|---|---|
| 2024 | $12,738 | $1,170,200 | $231,500 | $938,700 |
| 2023 | $12,738 | $1,219,100 | $208,500 | $1,010,600 |
| 2022 | $11,553 | $1,211,000 | $177,400 | $1,033,600 |
| 2021 | $11,109 | $967,900 | $154,200 | $813,700 |
| 2020 | $11,514 | $861,300 | $153,200 | $708,100 |
| 2019 | $2,607 | $871,000 | $152,200 | $718,800 |
| 2018 | $1,855 | $137,500 | $137,500 | $0 |
| 2017 | $1,540 | $122,800 | $122,800 | $0 |
| 2016 | $1,328 | $107,300 | $107,300 | $0 |
| 2014 | -- | $105,750 | $105,750 | $0 |
Source: Public Records
Map
Nearby Homes
- 2418 22nd Ave SE
- 2413 28th Ave SE
- 2802 Burnaby Park Loop SE
- 1824 Fairview St SE
- 1720 Wilson St SE
- 0 xx Fairview St SE
- 1820 Chipman St SE Unit A&B
- 1816 Chipman St SE Unit A&B
- 1910 van Epps St SE
- 2025 Eskridge Blvd SE
- 3056 Edgewood Dr SE
- 2221 15th Ave SE
- 1812 Amhurst St SE
- 2911 Stirling Ct SE
- 3014 21st Ave SE
- 1717 14th Ave SE
- 2534 Wedgewood Ct SE
- 2937 Lybarger St SE
- 1103 Creekwood Ct SE
- 1622 14th Ave SE
- 2261 Nut Tree Loop SE
- 2253 Nut Tree Loop SE
- 2247 Nut Tree Loop SE
- 2249 Nut Tree Loop SE
- 2215 Cypress Place SE
- 2221 Cypress Place SE
- 2203 Cypress Place SE
- 2206 Nut Tree Loop SE
- 2245 Nut Tree Loop SE
- 2115 Brown St SE
- 2304 22nd Ave SE
- 2244 Nut Tree Loop SE
- 2208 Nut Tree Loop SE
- 2223 Cypress Place SE
- 2203 Nut Tree Loop SE
- 2316 Holly Ln SE
- 2201 Nut Tree Loop SE
- 2208 22nd Ave SE
- 2109 Brown St SE