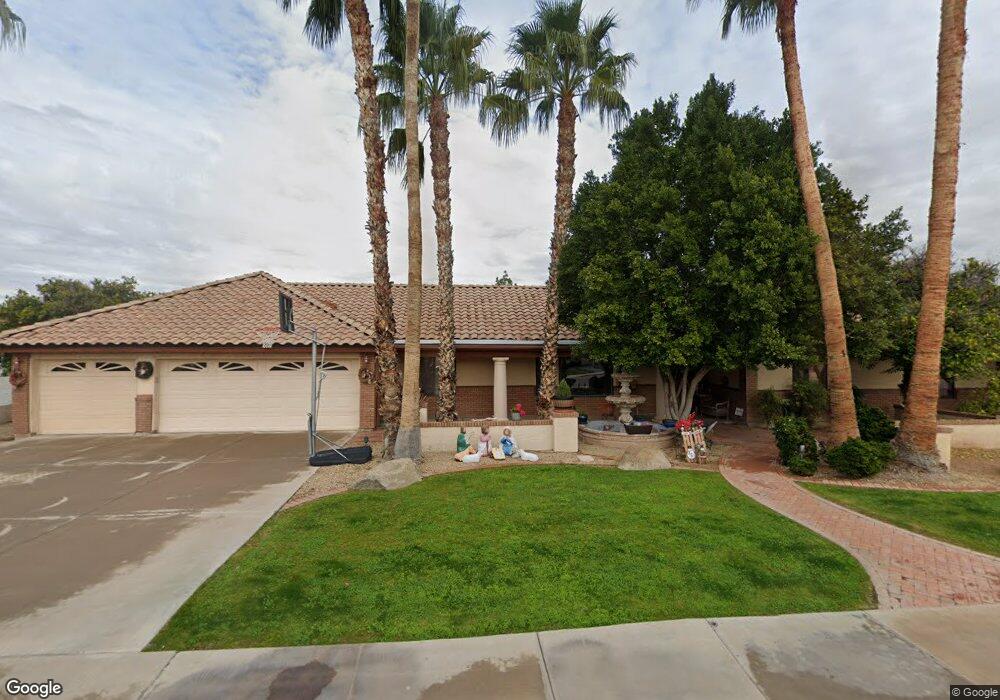
2258 E Laurel St Mesa, AZ 85213
Rancho de Arboleda NeighborhoodEstimated Value: $691,925 - $831,000
4
Beds
3
Baths
3,018
Sq Ft
$253/Sq Ft
Est. Value
About This Home
This home is located at 2258 E Laurel St, Mesa, AZ 85213 and is currently estimated at $762,481, approximately $252 per square foot. 2258 E Laurel St is a home located in Maricopa County with nearby schools including Hermosa Vista Elementary School, Franklin at Brimhall Elementary School, and Franklin West Elementary School.
Ownership History
Date
Name
Owned For
Owner Type
Purchase Details
Closed on
May 22, 2008
Sold by
Norenberg Eric Peter and Norenberg Kaye T
Bought by
Smith David L and Smith Kate L
Current Estimated Value
Home Financials for this Owner
Home Financials are based on the most recent Mortgage that was taken out on this home.
Original Mortgage
$348,000
Outstanding Balance
$220,271
Interest Rate
5.87%
Mortgage Type
New Conventional
Estimated Equity
$542,210
Purchase Details
Closed on
Jul 13, 2000
Sold by
Willman Patricia A
Bought by
Norenberg Eric Peter and Norenberg Kaye T
Home Financials for this Owner
Home Financials are based on the most recent Mortgage that was taken out on this home.
Original Mortgage
$150,000
Interest Rate
8.19%
Mortgage Type
New Conventional
Purchase Details
Closed on
Mar 1, 2000
Sold by
William Ford L
Bought by
Willman Patricia A
Create a Home Valuation Report for This Property
The Home Valuation Report is an in-depth analysis detailing your home's value as well as a comparison with similar homes in the area
Home Values in the Area
Average Home Value in this Area
Purchase History
| Date | Buyer | Sale Price | Title Company |
|---|---|---|---|
| Smith David L | $435,000 | Transnation Title Ins Co | |
| Norenberg Eric Peter | $275,000 | First American Title | |
| Willman Patricia A | -- | -- |
Source: Public Records
Mortgage History
| Date | Status | Borrower | Loan Amount |
|---|---|---|---|
| Open | Smith David L | $348,000 | |
| Previous Owner | Norenberg Eric Peter | $150,000 |
Source: Public Records
Tax History
| Year | Tax Paid | Tax Assessment Tax Assessment Total Assessment is a certain percentage of the fair market value that is determined by local assessors to be the total taxable value of land and additions on the property. | Land | Improvement |
|---|---|---|---|---|
| 2025 | $3,485 | $40,675 | -- | -- |
| 2024 | $3,497 | $38,738 | -- | -- |
| 2023 | $3,497 | $51,600 | $10,320 | $41,280 |
| 2022 | $3,414 | $40,670 | $8,130 | $32,540 |
| 2021 | $3,492 | $39,800 | $7,960 | $31,840 |
| 2020 | $3,443 | $37,670 | $7,530 | $30,140 |
| 2019 | $3,194 | $35,880 | $7,170 | $28,710 |
| 2018 | $3,047 | $34,300 | $6,860 | $27,440 |
| 2017 | $2,953 | $33,380 | $6,670 | $26,710 |
| 2016 | $2,898 | $33,880 | $6,770 | $27,110 |
| 2015 | $2,733 | $31,660 | $6,330 | $25,330 |
Source: Public Records
Map
Nearby Homes
- 2161 E Menlo Cir
- 2306 N Acacia
- 2142 E Minton St
- 2064 E Kenwood Cir
- 2040 E Norcroft St
- 2435 E Kenwood Cir
- 2057 N Ashbrook
- 2566 E Lynwood St
- 2455 N Kachina
- 2528 E Mckellips Rd Unit 15
- 1832 E Menlo St
- 2629 E Lockwood St
- 1821 E Lynwood St
- 2648 N Ridge
- 2360 N Yale
- 2560 N Lindsay Rd Unit 29
- 2438 N Forest Cir
- 1858 E Kramer St
- 1854 E Kramer St
- 1850 E Kramer St
- 2246 E Laurel St
- 2316 E Laurel St
- 2265 E Hermosa Vista Dr
- 2265 E Laurel St
- 2253 E Hermosa Vista Dr
- 2303 E Hermosa Vista Dr
- 2253 E Laurel St
- 2243 E Laurel St
- 2232 E Laurel St
- 2319 E Laurel St
- 2326 E Laurel St
- 2241 E Hermosa Vista Dr
- 2264 E Lynwood St
- 2317 E Hermosa Vista Dr
- 2252 E Lynwood St
- 2306 E Lynwood St
- 2331 E Laurel St
- 2242 E Lynwood St
- 2410 N Alamo
- 2314 E Lynwood St
Your Personal Tour Guide
Ask me questions while you tour the home.