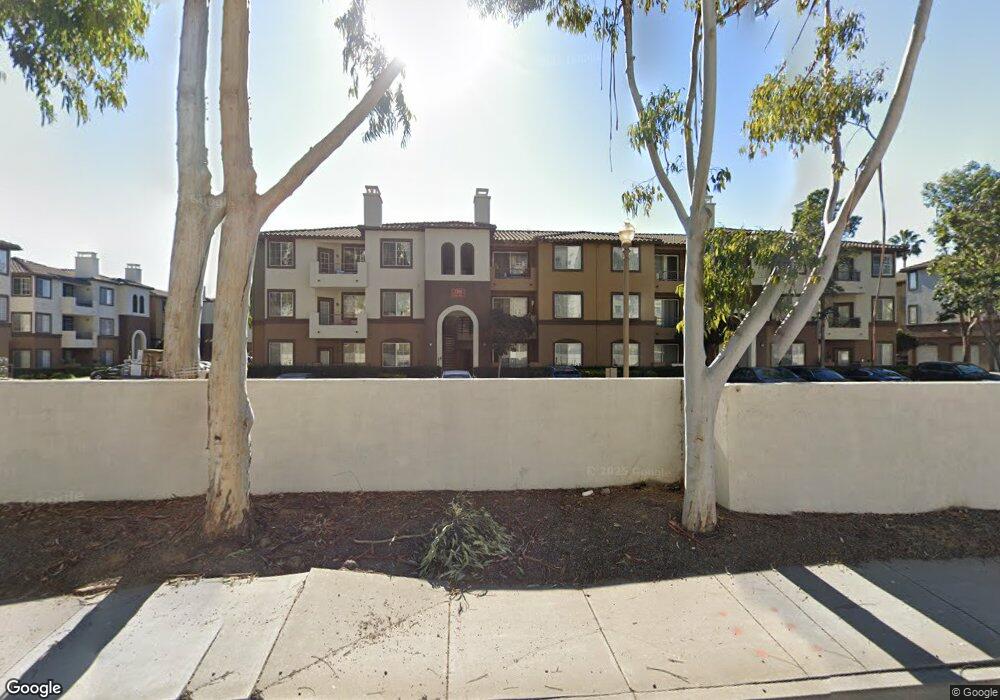
2258 Gill Village Way Unit 214 San Diego, CA 92108
Mission Valley NeighborhoodEstimated Value: $456,000 - $588,000
1
Bed
1
Bath
730
Sq Ft
$687/Sq Ft
Est. Value
About This Home
This home is located at 2258 Gill Village Way Unit 214, San Diego, CA 92108 and is currently estimated at $501,687, approximately $687 per square foot. 2258 Gill Village Way Unit 214 is a home located in San Diego County with nearby schools including Nipaquay Elementary, Jones Elementary School, and Taft Middle School.
Ownership History
Date
Name
Owned For
Owner Type
Purchase Details
Closed on
Feb 6, 2014
Sold by
The Missions I L P
Bought by
The Missions I L P
Current Estimated Value
Purchase Details
Closed on
Nov 19, 2013
Sold by
Ragland Thomas L
Bought by
The Mission I Lp
Purchase Details
Closed on
Oct 26, 2010
Sold by
Holliday Jerry
Bought by
Ragland Thomas L
Purchase Details
Closed on
Jan 17, 2006
Sold by
California Ldm Missions Llc
Bought by
Holliday Jerry
Home Financials for this Owner
Home Financials are based on the most recent Mortgage that was taken out on this home.
Original Mortgage
$49,785
Interest Rate
6.21%
Mortgage Type
Credit Line Revolving
Purchase Details
Closed on
Sep 20, 2005
Sold by
Holliday Lina Sakalauskaite
Bought by
Holliday Jerry
Create a Home Valuation Report for This Property
The Home Valuation Report is an in-depth analysis detailing your home's value as well as a comparison with similar homes in the area
Home Values in the Area
Average Home Value in this Area
Purchase History
| Date | Buyer | Sale Price | Title Company |
|---|---|---|---|
| The Missions I L P | -- | Chicago Title Company | |
| The Mission I Lp | $1,750,000 | Chicago Title Company | |
| Ragland Thomas L | $169,000 | Stewart Title Company | |
| Holliday Jerry | $332,000 | Chicago Title Co | |
| Holliday Jerry | -- | Chicago Title Co |
Source: Public Records
Mortgage History
| Date | Status | Borrower | Loan Amount |
|---|---|---|---|
| Previous Owner | Holliday Jerry | $49,785 | |
| Previous Owner | Holliday Jerry | $265,520 |
Source: Public Records
Tax History Compared to Growth
Tax History
| Year | Tax Paid | Tax Assessment Tax Assessment Total Assessment is a certain percentage of the fair market value that is determined by local assessors to be the total taxable value of land and additions on the property. | Land | Improvement |
|---|---|---|---|---|
| 2025 | $3,731 | $306,453 | $196,130 | $110,323 |
| 2024 | $3,731 | $300,445 | $192,285 | $108,160 |
| 2023 | $3,649 | $294,555 | $188,515 | $106,040 |
| 2022 | $3,552 | $288,780 | $184,819 | $103,961 |
| 2021 | $3,528 | $283,119 | $181,196 | $101,923 |
| 2020 | $3,485 | $280,217 | $179,339 | $100,878 |
| 2019 | $3,424 | $274,723 | $175,823 | $98,900 |
| 2018 | $3,203 | $269,337 | $172,376 | $96,961 |
| 2017 | $3,127 | $264,057 | $168,997 | $95,060 |
| 2016 | $3,077 | $258,881 | $165,684 | $93,197 |
| 2015 | $3,033 | $254,994 | $163,196 | $91,798 |
| 2014 | $2,033 | $169,000 | $80,000 | $89,000 |
Source: Public Records
Map
Nearby Homes
- 8211 Station Village Ln Unit 1201
- 8211 Station Village Ln Unit 1103
- 8275 Station Village Ln Unit 3201
- 8300 Station Village Ln Unit 2
- 8301 Rio San Diego Dr Unit 7
- 7974 Mission Center Ct Unit H
- 8355 Station Village Ln Unit 4417
- 8069 Caminito de Pizza Unit A
- 8015 Caminito de Pizza Unit B
- 8019 Caminito de Pizza Unit B
- 8023 Caminito de Pizza Unit E
- 8027 Caminito de Pizza Unit B
- 8075 Caminito de Pizza Unit C
- 1341 Caminito Gabaldon Unit A
- 1349 Caminito Gabaldon Unit C
- 1395 Caminito Gabaldon Unit C
- 1317 Caminito Gabaldon Unit B
- 7954 Mission Center Ct Unit B
- 7952 Mission Center Ct Unit D
- 7853 Inception Way
- 2188 Gill Village Way
- 8228 Station Village Ln Unit 1503
- 2218 Gill Village Way Unit 1003
- 8232 Station Village Ln Unit 1905
- 8232 Station Village Ln Unit 1911
- 8232 Station Village Ln Unit 1902
- 8228 Station Village Ln
- 8228 Station Village Ln Unit 1502
- 8228 Station Village Ln Unit 1512
- 8228 Station Village Ln
- 8232 Station Village Ln
- 8252 Station Village Ln
- 8256 Station Village Ln
- 2190 Gill Village Way
- 2212 Gill Village Way
- 2186 Gill Village Way
- 2274 Gill Village Way
- 8256 Station Village Ln Unit 2416
- 8256 Station Village Ln Unit 2415
- 8256 Station Village Ln Unit 2414