Estimated Value: $1,050,000 - $1,117,000
6
Beds
4
Baths
3,393
Sq Ft
$318/Sq Ft
Est. Value
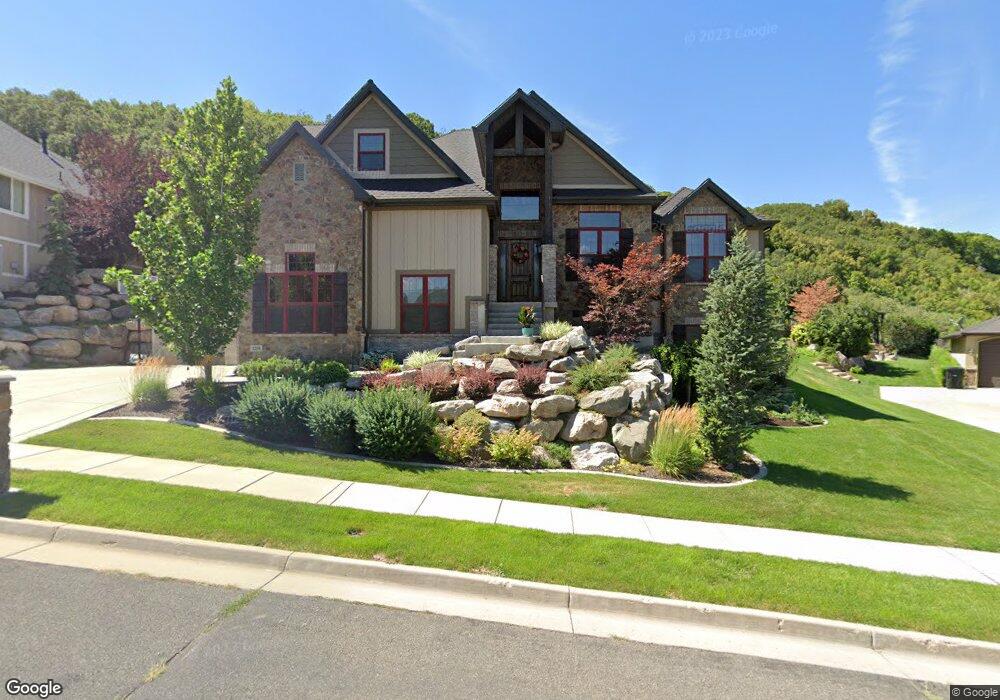
About This Home
This home is located at 2259 E 8300 S, Ogden, UT 84405 and is currently estimated at $1,080,013, approximately $318 per square foot. 2259 E 8300 S is a home with nearby schools including South Weber Elementary School, Sunset Junior High School, and Northridge High School.
Ownership History
Date
Name
Owned For
Owner Type
Purchase Details
Closed on
Jun 5, 2014
Sold by
Lowry David and Lowry Lynette
Bought by
Lowry Lynette and The Lynette Lowry Trust
Current Estimated Value
Purchase Details
Closed on
Dec 19, 2012
Sold by
Nilson And Company Inc
Bought by
Lowry David and Lowry Lynette
Home Financials for this Owner
Home Financials are based on the most recent Mortgage that was taken out on this home.
Original Mortgage
$542,758
Outstanding Balance
$368,852
Interest Rate
3.27%
Mortgage Type
Construction
Estimated Equity
$711,161
Create a Home Valuation Report for This Property
The Home Valuation Report is an in-depth analysis detailing your home's value as well as a comparison with similar homes in the area
Purchase History
| Date | Buyer | Sale Price | Title Company |
|---|---|---|---|
| Lowry Lynette | -- | Accommodation | |
| Lowry David | -- | Bonneville Superior Title Co |
Source: Public Records
Mortgage History
| Date | Status | Borrower | Loan Amount |
|---|---|---|---|
| Open | Lowry David | $542,758 |
Source: Public Records
Tax History
| Year | Tax Paid | Tax Assessment Tax Assessment Total Assessment is a certain percentage of the fair market value that is determined by local assessors to be the total taxable value of land and additions on the property. | Land | Improvement |
|---|---|---|---|---|
| 2025 | $5,986 | $553,300 | $108,611 | $444,689 |
| 2024 | $5,669 | $535,700 | $91,617 | $444,083 |
| 2023 | $5,336 | $914,000 | $146,756 | $767,244 |
| 2022 | $5,995 | $571,450 | $84,616 | $486,834 |
| 2021 | $5,492 | $797,000 | $121,081 | $675,919 |
| 2020 | $5,050 | $712,000 | $110,760 | $601,240 |
| 2019 | $5,175 | $717,000 | $99,865 | $617,135 |
| 2018 | $4,718 | $685,000 | $89,020 | $595,980 |
| 2016 | $4,509 | $345,455 | $40,637 | $304,818 |
| 2015 | $4,309 | $312,785 | $40,637 | $272,148 |
| 2014 | $3,813 | $281,342 | $46,709 | $234,633 |
| 2013 | -- | $73,678 | $38,465 | $35,213 |
Source: Public Records
Map
Nearby Homes
- 2357 E 8100 S
- 7886 S 2100 E
- 8036 S 2575 E
- 7841 Peachwood Dr
- 2586 Deer Run Dr
- 7897 S 2700 E Unit 303
- 7897 S 2700 E Unit 305
- 3232 N Redtail Way
- 2765 E 7825 S
- 3297 N Layton Ridge Dr
- 3532 N Layton Ridge Dr
- 2353 Canyon View Dr
- 1827 E Whitetail Dr
- 7478 1980 E
- 7466 S 1980 E
- 1821 E Whitetail Way
- 1935 Deere Valley Dr
- 1911 Deere Valley Dr
- 3176 N 1450 E
- 1785 E 2825 N
- 2273 E 8300 S
- 8255 S 2260 E
- 2288 E 8300 S
- 8252 S 2260 E
- 8249 S 2260 E
- 2291 E 8300 S
- 2304 E 8300 S Unit 52
- 2293 E 8240 S Unit 44
- 2293 E 8240 S
- 2307 E 8300 S
- 2264 E 8240 S Unit 39
- 2309 E 8240 S
- 2320 E 8300 S
- 2264 E 8240 S
- 2280 E 8240 S
- 2296 E 8240 S
- 2323 E 8300 S
- 2331 E 8240 S
- 2334 E 8300 S
- 8124 S 2275 E
Your Personal Tour Guide
Ask me questions while you tour the home.