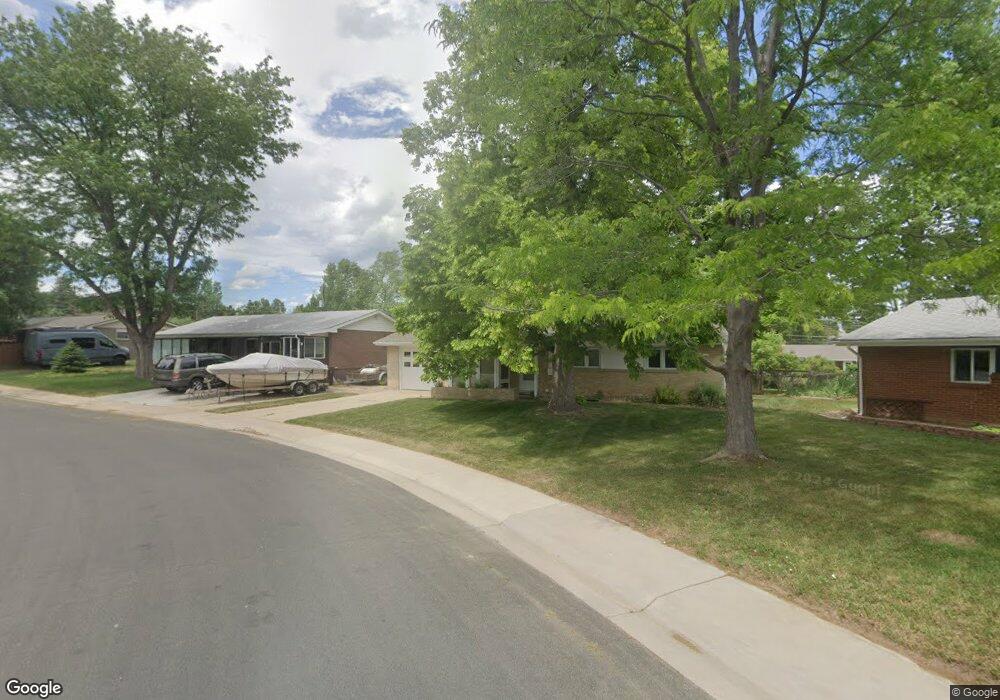
2259 Nicholl St E Boulder, CO 80304
Central Boulder NeighborhoodEstimated Value: $870,000 - $1,263,000
2
Beds
1
Bath
1,104
Sq Ft
$909/Sq Ft
Est. Value
About This Home
This home is located at 2259 Nicholl St E, Boulder, CO 80304 and is currently estimated at $1,003,581, approximately $909 per square foot. 2259 Nicholl St E is a home located in Boulder County with nearby schools including Columbine Elementary School, Casey Middle School, and Boulder High School.
Ownership History
Date
Name
Owned For
Owner Type
Purchase Details
Closed on
Apr 19, 2004
Sold by
Alstrin April L and Opansky Brian Joseph
Bought by
Alstrin April L
Current Estimated Value
Home Financials for this Owner
Home Financials are based on the most recent Mortgage that was taken out on this home.
Original Mortgage
$192,000
Outstanding Balance
$88,838
Interest Rate
5.42%
Mortgage Type
New Conventional
Estimated Equity
$914,743
Purchase Details
Closed on
Mar 28, 1995
Sold by
Kammerer Jill E
Bought by
Alstrin April L
Home Financials for this Owner
Home Financials are based on the most recent Mortgage that was taken out on this home.
Original Mortgage
$152,250
Interest Rate
6.2%
Purchase Details
Closed on
Jun 29, 1992
Bought by
Alstrin April L
Purchase Details
Closed on
Feb 28, 1992
Bought by
Alstrin April L
Purchase Details
Closed on
Nov 3, 1976
Bought by
Alstrin April L
Create a Home Valuation Report for This Property
The Home Valuation Report is an in-depth analysis detailing your home's value as well as a comparison with similar homes in the area
Home Values in the Area
Average Home Value in this Area
Purchase History
| Date | Buyer | Sale Price | Title Company |
|---|---|---|---|
| Alstrin April L | -- | -- | |
| Alstrin April L | $169,200 | Land Title | |
| Alstrin April L | $126,000 | -- | |
| Alstrin April L | $80,000 | -- | |
| Alstrin April L | $36,000 | -- |
Source: Public Records
Mortgage History
| Date | Status | Borrower | Loan Amount |
|---|---|---|---|
| Open | Alstrin April L | $192,000 | |
| Closed | Alstrin April L | $152,250 |
Source: Public Records
Tax History
| Year | Tax Paid | Tax Assessment Tax Assessment Total Assessment is a certain percentage of the fair market value that is determined by local assessors to be the total taxable value of land and additions on the property. | Land | Improvement |
|---|---|---|---|---|
| 2025 | $4,852 | $48,719 | $43,847 | $4,872 |
| 2024 | $4,852 | $48,719 | $43,847 | $4,872 |
| 2023 | $4,768 | $55,208 | $53,004 | $5,889 |
| 2022 | $4,167 | $44,869 | $40,382 | $4,487 |
| 2021 | $3,973 | $46,160 | $41,544 | $4,616 |
| 2020 | $3,345 | $38,431 | $30,745 | $7,686 |
| 2019 | $3,294 | $38,431 | $30,745 | $7,686 |
| 2018 | $3,159 | $36,439 | $29,160 | $7,279 |
| 2017 | $3,060 | $40,286 | $32,238 | $8,048 |
| 2016 | $3,169 | $36,608 | $29,293 | $7,315 |
| 2015 | $3,001 | $31,211 | $15,522 | $15,689 |
| 2014 | $2,624 | $31,211 | $15,522 | $15,689 |
Source: Public Records
Map
Nearby Homes
- 3055 23rd St
- 2901 Lorraine Ct
- 2991 25th St
- 3145 Fremont St
- 2085 Balsam Dr
- 2727 Folsom St Unit 303
- 2727 Folsom St Unit 115
- 2525 Balsam Dr
- 2340 Panorama Ave
- 2410 Grape Ave
- 3150 19th St
- 2595 Glenwood Dr
- 2870 18th St
- 2515 Bluff St
- 2240 Bluff St
- 2435 Hawthorn Ave
- 2707 Valmont Rd Unit D-304
- 2707 Valmont Rd Unit 106 Bonus!
- 2707 Valmont Rd Unit 311A
- 3225 Arnett St
- 2263 Nicholl St E
- 2255 Nicholl St E
- 2180 Floral Dr
- 2200 Floral Dr
- 2170 Floral Dr
- 2251 Nicholl St W
- 2267 Nicholl St E
- 2254 Nicholl St E
- 2210 Floral Dr
- 2160 Floral Dr
- 2260 Nicholl St E
- 2220 Floral Dr
- 2271 Nicholl St E
- 2247 Nicholl St W
- 2248 Nicholl St W
- 2150 Floral Dr
- 2981 Lorraine Ct
- 2242 Nicholl St W
- 2230 Floral Dr
- 2960 Lorraine Ct
Your Personal Tour Guide
Ask me questions while you tour the home.