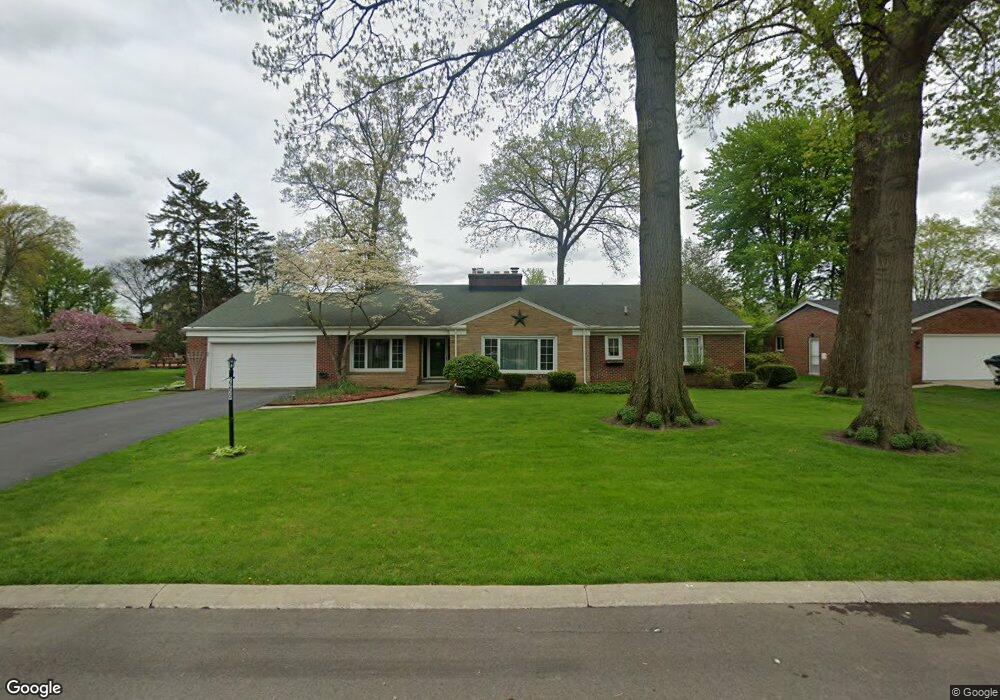
2259 Timberlawn Rd Toledo, OH 43614
Glendale-Heatherdowns NeighborhoodEstimated Value: $245,000 - $307,627
3
Beds
3
Baths
2,474
Sq Ft
$112/Sq Ft
Est. Value
About This Home
This home is located at 2259 Timberlawn Rd, Toledo, OH 43614 and is currently estimated at $276,657, approximately $111 per square foot. 2259 Timberlawn Rd is a home located in Lucas County with nearby schools including Maumee Intermediate School, Fort Miami Elementary School, and Maumee Middle School.
Ownership History
Date
Name
Owned For
Owner Type
Purchase Details
Closed on
Mar 2, 2018
Sold by
Keating Keith J and Keating Marsha S
Bought by
Gankosky Matthew
Current Estimated Value
Home Financials for this Owner
Home Financials are based on the most recent Mortgage that was taken out on this home.
Original Mortgage
$168,547
Outstanding Balance
$144,225
Interest Rate
4.32%
Mortgage Type
VA
Estimated Equity
$132,432
Purchase Details
Closed on
May 15, 2001
Sold by
Sevrence Lois R
Bought by
Keating Keith J and Keating Marsha S
Home Financials for this Owner
Home Financials are based on the most recent Mortgage that was taken out on this home.
Original Mortgage
$136,800
Interest Rate
7.02%
Purchase Details
Closed on
Nov 29, 2000
Sold by
Louisville Title Agency For Nw Ohio Inc
Bought by
Sevrence Lois R
Purchase Details
Closed on
Sep 7, 1988
Sold by
Sevence Robert G and Sevence Lois R
Create a Home Valuation Report for This Property
The Home Valuation Report is an in-depth analysis detailing your home's value as well as a comparison with similar homes in the area
Home Values in the Area
Average Home Value in this Area
Purchase History
| Date | Buyer | Sale Price | Title Company |
|---|---|---|---|
| Gankosky Matthew | $165,000 | Liberty Title Inc | |
| Keating Keith J | $152,000 | First Capital | |
| Sevrence Lois R | $29,900 | Louisville Title Agency For | |
| -- | -- | -- |
Source: Public Records
Mortgage History
| Date | Status | Borrower | Loan Amount |
|---|---|---|---|
| Open | Gankosky Matthew | $168,547 | |
| Previous Owner | Keating Keith J | $136,800 |
Source: Public Records
Tax History Compared to Growth
Tax History
| Year | Tax Paid | Tax Assessment Tax Assessment Total Assessment is a certain percentage of the fair market value that is determined by local assessors to be the total taxable value of land and additions on the property. | Land | Improvement |
|---|---|---|---|---|
| 2024 | $2,899 | $89,460 | $15,960 | $73,500 |
| 2023 | $5,015 | $65,905 | $13,335 | $52,570 |
| 2022 | $4,822 | $65,905 | $13,335 | $52,570 |
| 2021 | $5,043 | $65,905 | $13,335 | $52,570 |
| 2020 | $4,837 | $54,915 | $11,130 | $43,785 |
| 2019 | $4,706 | $54,915 | $11,130 | $43,785 |
| 2018 | $4,587 | $54,915 | $11,130 | $43,785 |
| 2017 | $4,485 | $51,940 | $10,325 | $41,615 |
| 2016 | $4,492 | $148,400 | $29,500 | $118,900 |
| 2015 | $4,481 | $148,400 | $29,500 | $118,900 |
| 2014 | $3,838 | $51,950 | $10,330 | $41,620 |
| 2013 | $3,838 | $51,950 | $10,330 | $41,620 |
Source: Public Records
Map
Nearby Homes
- 3728 Richlawn Dr
- 3770 Heatherdowns Blvd
- 3679 Elmlawn Dr
- 1969 Oaklawn Dr
- 1553 Heather Meadow Dr
- 2566 Green Valley Dr
- 3619 Prairie Ave
- 3626 Greenlawn Ct
- 3651 Treelawn Dr
- 1953 Heatherlawn Dr
- 5022 Stengel Ave
- 4237 Brogan Dr
- 1970 Cherrylawn Dr
- 1377 Kirk St
- 2451 Eastgate Rd
- 5125 Stengel Ave
- 1733 Parkway Dr N
- 1736 Parkway Dr N
- 2930 S Byrne Rd
- 1725 Parkway Dr S
- 2269 Timberlawn Rd
- 3827 Tall Oaks Rd
- 3835 Tall Oaks Rd
- 3817 Tall Oaks Rd
- 2303 Timberlawn Rd
- 2258 W Country Club Pkwy
- 2264 Timberlawn Rd
- 2266 W Country Club Pkwy
- 2254 Timberlawn Rd
- 2274 Timberlawn Rd
- 3807 Tall Oaks Rd
- 2313 Timberlawn Rd
- 2274 W Country Club Pkwy
- 2244 Timberlawn Rd
- 2308 Timberlawn Rd
- 3828 Tall Oaks Rd
- 3836 Tall Oaks Rd
- 3818 Tall Oaks Rd
- 3848 Tall Oaks Rd
- 2304 W Country Club Pkwy