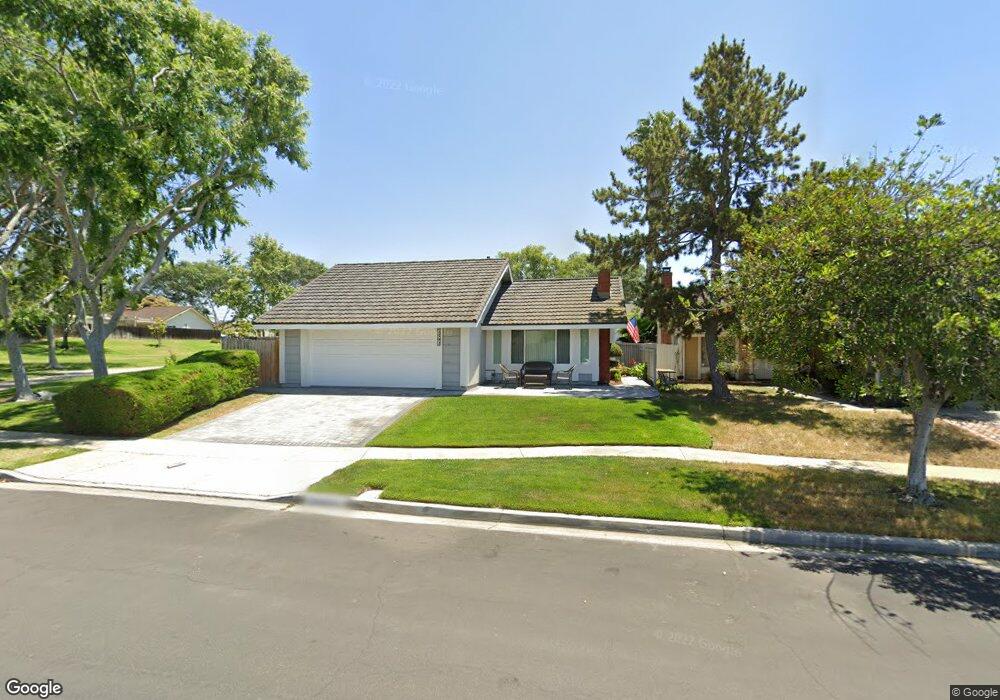
22592 Killy St Lake Forest, CA 92630
Estimated Value: $1,149,000 - $1,199,355
3
Beds
2
Baths
1,471
Sq Ft
$799/Sq Ft
Est. Value
About This Home
This home is located at 22592 Killy St, Lake Forest, CA 92630 and is currently estimated at $1,175,589, approximately $799 per square foot. 22592 Killy St is a home located in Orange County with nearby schools including La Madera Elementary School, Serrano Intermediate School, and El Toro High School.
Ownership History
Date
Name
Owned For
Owner Type
Purchase Details
Closed on
Mar 10, 2003
Sold by
Ching Brian A and Roberts Richard
Bought by
Stephens Kevin K and Stephens Bonnie S
Current Estimated Value
Home Financials for this Owner
Home Financials are based on the most recent Mortgage that was taken out on this home.
Original Mortgage
$310,000
Interest Rate
5.54%
Purchase Details
Closed on
Oct 11, 1999
Sold by
Brian Ching
Bought by
Ching Brian A and Roberts Richard
Home Financials for this Owner
Home Financials are based on the most recent Mortgage that was taken out on this home.
Original Mortgage
$220,500
Interest Rate
7.82%
Purchase Details
Closed on
Oct 24, 1997
Sold by
Ching Brian A
Bought by
Ching Brian A
Purchase Details
Closed on
Jul 24, 1996
Sold by
Jorgensen Chris H and Jorgensen Elaine I
Bought by
Ching Brian A
Home Financials for this Owner
Home Financials are based on the most recent Mortgage that was taken out on this home.
Original Mortgage
$181,800
Interest Rate
8.18%
Mortgage Type
Balloon
Create a Home Valuation Report for This Property
The Home Valuation Report is an in-depth analysis detailing your home's value as well as a comparison with similar homes in the area
Home Values in the Area
Average Home Value in this Area
Purchase History
| Date | Buyer | Sale Price | Title Company |
|---|---|---|---|
| Stephens Kevin K | $410,000 | First American Title Co | |
| Ching Brian A | -- | -- | |
| Ching Brian A | -- | -- | |
| Ching Brian A | $202,000 | Fidelity National Title |
Source: Public Records
Mortgage History
| Date | Status | Borrower | Loan Amount |
|---|---|---|---|
| Previous Owner | Stephens Kevin K | $310,000 | |
| Previous Owner | Ching Brian A | $220,500 | |
| Previous Owner | Ching Brian A | $181,800 |
Source: Public Records
Tax History Compared to Growth
Tax History
| Year | Tax Paid | Tax Assessment Tax Assessment Total Assessment is a certain percentage of the fair market value that is determined by local assessors to be the total taxable value of land and additions on the property. | Land | Improvement |
|---|---|---|---|---|
| 2025 | $6,092 | $596,856 | $463,720 | $133,136 |
| 2024 | $6,092 | $585,153 | $454,627 | $130,526 |
| 2023 | $5,947 | $573,680 | $445,713 | $127,967 |
| 2022 | $5,840 | $562,432 | $436,974 | $125,458 |
| 2021 | $5,723 | $551,404 | $428,405 | $122,999 |
| 2020 | $5,671 | $545,751 | $424,013 | $121,738 |
| 2019 | $5,556 | $535,050 | $415,699 | $119,351 |
| 2018 | $5,451 | $524,559 | $407,548 | $117,011 |
| 2017 | $5,341 | $514,274 | $399,557 | $114,717 |
| 2016 | $5,251 | $504,191 | $391,723 | $112,468 |
| 2015 | $5,160 | $494,083 | $385,839 | $108,244 |
| 2014 | $5,048 | $484,405 | $378,281 | $106,124 |
Source: Public Records
Map
Nearby Homes
- 22461 Silver Spur
- 22718 Via Castilla
- 25312 Pizarro Rd
- 22862 Bonita Ln
- 22844 Mesa Way Unit 2
- 25614 Mont Pointe Unit 3D
- 22962 Springwater
- 25644 Mont Pointe Unit 1A
- 25631 Mont Pointe Unit 7D
- 25331 Via Viejo
- 22201 Center Pointe Unit 2D
- 25885 Trabuco Rd Unit 206
- 25885 Trabuco Rd Unit 91
- 25885 Trabuco Rd Unit 306
- 25885 Trabuco Rd Unit 33
- 25885 Trabuco Rd Unit 226
- 25885 Trabuco Rd Unit 271
- 25671 Le Parc Unit 85
- 25671 Le Parc Unit 82
- 25495 Morningstar Rd
- 22596 Killy St
- 22602 Killy St
- 22635 Claude Cir
- 22631 Claude Cir
- 22641 Claude Cir
- 22606 Killy St
- 22591 Killy St
- 22581 Killy St
- 22595 Killy St
- 22645 Claude Cir
- 22575 Killy St
- 22601 Killy St
- 22612 Killy St
- 22565 Killy St
- 22556 Killy St
- 22651 Claude Cir
- 22605 Killy St
- 22591 Claude Cir
- 22561 Killy St
- 22616 Killy St