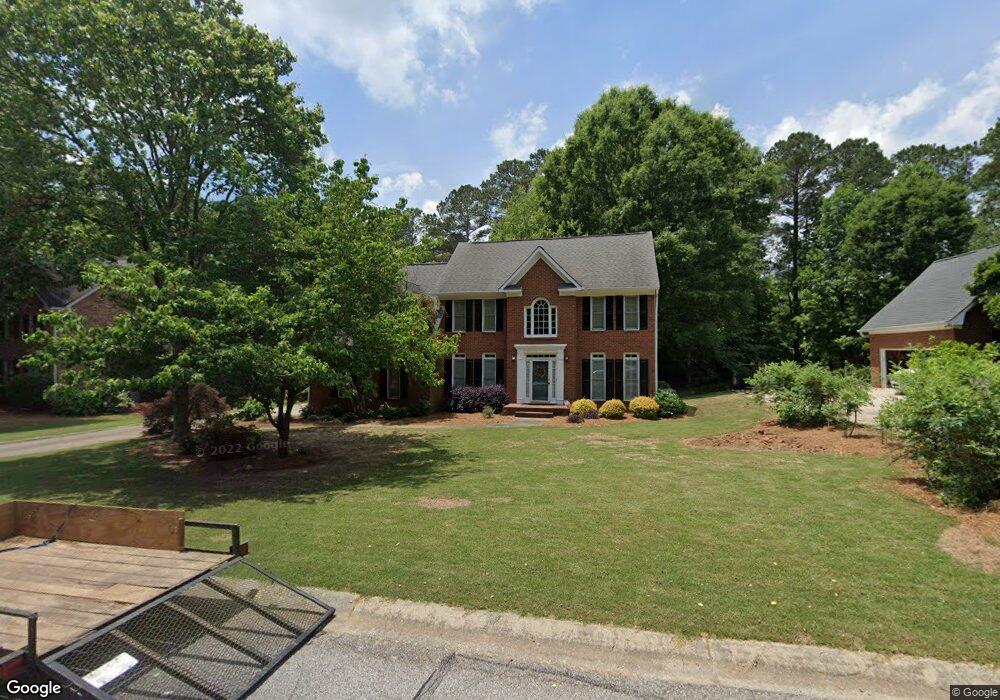
226 Columns Ln Peachtree City, GA 30269
Estimated Value: $596,352 - $642,000
--
Bed
--
Bath
2,908
Sq Ft
$214/Sq Ft
Est. Value
About This Home
This home is located at 226 Columns Ln, Peachtree City, GA 30269 and is currently estimated at $621,451, approximately $213 per square foot. 226 Columns Ln is a home located in Fayette County with nearby schools including Braelinn Elementary School, Rising Starr Middle School, and Starrs Mill High School.
Ownership History
Date
Name
Owned For
Owner Type
Purchase Details
Closed on
Jun 27, 2025
Sold by
Tyus Andrea D and Tyus Robert Keith
Bought by
Johnson Daniel M and Johnson Cayla A
Current Estimated Value
Home Financials for this Owner
Home Financials are based on the most recent Mortgage that was taken out on this home.
Original Mortgage
$635,510
Outstanding Balance
$634,436
Interest Rate
6.86%
Mortgage Type
VA
Estimated Equity
-$12,985
Purchase Details
Closed on
Jul 20, 2000
Sold by
Hankins James E and Hankins Gail M
Bought by
Tyus Robert K and Tyus Andrea D
Home Financials for this Owner
Home Financials are based on the most recent Mortgage that was taken out on this home.
Original Mortgage
$163,000
Interest Rate
8.3%
Mortgage Type
New Conventional
Purchase Details
Closed on
Aug 1, 1996
Sold by
Parrilli Michael F Mary T
Bought by
Hankins James E
Create a Home Valuation Report for This Property
The Home Valuation Report is an in-depth analysis detailing your home's value as well as a comparison with similar homes in the area
Home Values in the Area
Average Home Value in this Area
Purchase History
| Date | Buyer | Sale Price | Title Company |
|---|---|---|---|
| Johnson Daniel M | $635,600 | None Listed On Document | |
| Johnson Daniel M | $635,600 | None Listed On Document | |
| Tyus Robert K | $254,000 | -- | |
| Hankins James E | $225,500 | -- |
Source: Public Records
Mortgage History
| Date | Status | Borrower | Loan Amount |
|---|---|---|---|
| Open | Johnson Daniel M | $635,510 | |
| Closed | Johnson Daniel M | $635,510 | |
| Previous Owner | Tyus Robert K | $163,000 | |
| Closed | Hankins James E | $0 |
Source: Public Records
Tax History Compared to Growth
Tax History
| Year | Tax Paid | Tax Assessment Tax Assessment Total Assessment is a certain percentage of the fair market value that is determined by local assessors to be the total taxable value of land and additions on the property. | Land | Improvement |
|---|---|---|---|---|
| 2024 | $4,798 | $183,956 | $28,500 | $155,456 |
| 2023 | $4,253 | $176,380 | $28,500 | $147,880 |
| 2022 | $4,606 | $168,700 | $28,500 | $140,200 |
| 2021 | $4,340 | $146,500 | $28,500 | $118,000 |
| 2020 | $4,360 | $142,380 | $28,500 | $113,880 |
| 2019 | $4,138 | $133,940 | $28,500 | $105,440 |
| 2018 | $4,205 | $133,940 | $28,500 | $105,440 |
| 2017 | $3,858 | $143,820 | $28,500 | $115,320 |
| 2016 | $4,104 | $125,220 | $28,500 | $96,720 |
| 2015 | $3,856 | $115,900 | $28,500 | $87,400 |
| 2014 | $3,576 | $105,820 | $28,500 | $77,320 |
| 2013 | -- | $101,380 | $0 | $0 |
Source: Public Records
Map
Nearby Homes
- 125 Chadwick Dr
- 638 Grecken Green
- 423 Holly Grove Church Rd
- 401 Vardon Way
- 608 Preserve Place
- 105 Kraftwood Park
- 1607 Dumbarton Ln
- 121 Tamerlane
- 211 Felspar Ridge
- 613 Preserve Place
- 155 W Creek Ct
- 313 Evian Way
- 1306 Yarborough Dr
- 418 Holly Brook Ln
- 122 Holly Springs Dr
- 802 Agate Edge
- 1017 Pinehurst Dr
- 307 Bellingrath Ct
- 1018 Pinehurst Dr
- 555 Mountains Edge
- 224 Columns Ln Unit 24
- 224 Columns Ln Unit 2
- 228 Columns Ln
- 119 Colonnade Dr Unit 1
- 117 Colonnade Dr
- 222 Columns Ln
- 0 Columns Ln Unit 8670473
- 0 Columns Ln Unit 8467140
- 230 Columns Ln
- 227 Columns Ln
- 121 Colonnade Dr
- 229 Columns Ln
- 225 Columns Ln
- 115 Colonnade Dr
- 123 Colonnade Dr
- 231 Columns Ln Unit 2
- 223 Columns Ln
- 220 Columns Ln
- 232 Columns Ln Unit 2
- 113 Colonnade Dr