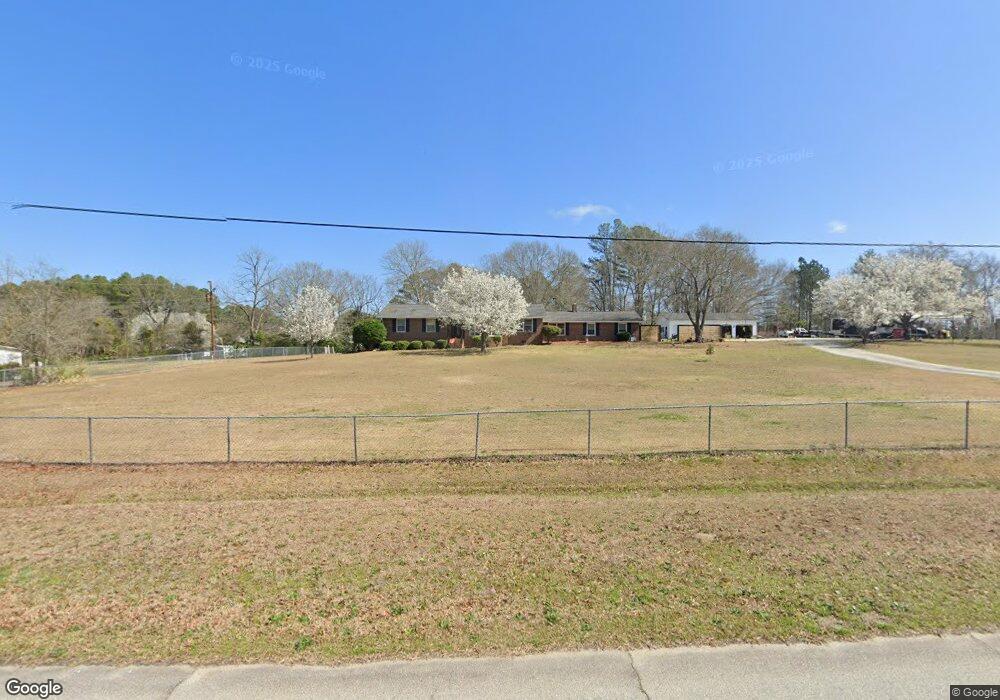
226 Elam Heights Lincolnton, GA 30817
Estimated Value: $408,000 - $470,000
4
Beds
3
Baths
2,825
Sq Ft
$153/Sq Ft
Est. Value
About This Home
This home is located at 226 Elam Heights, Lincolnton, GA 30817 and is currently estimated at $431,129, approximately $152 per square foot. 226 Elam Heights is a home located in Lincoln County with nearby schools including Lincoln County Elementary School, Lincoln County Middle School, and Lincoln County High School.
Ownership History
Date
Name
Owned For
Owner Type
Purchase Details
Closed on
Jul 10, 2020
Sold by
Gibson Wayne
Bought by
Simons Vernon N
Current Estimated Value
Home Financials for this Owner
Home Financials are based on the most recent Mortgage that was taken out on this home.
Original Mortgage
$201,286
Outstanding Balance
$178,425
Interest Rate
3.2%
Mortgage Type
FHA
Estimated Equity
$252,704
Purchase Details
Closed on
Jul 9, 2020
Sold by
Mize Rhonda G
Bought by
Simons Vernon N
Home Financials for this Owner
Home Financials are based on the most recent Mortgage that was taken out on this home.
Original Mortgage
$201,286
Outstanding Balance
$178,425
Interest Rate
3.2%
Mortgage Type
FHA
Estimated Equity
$252,704
Purchase Details
Closed on
Oct 11, 1994
Sold by
Pinson Eleanor
Bought by
Gibson Wayne
Purchase Details
Closed on
Jul 6, 1989
Sold by
Durham Joe V
Bought by
Pinson Eleanor
Purchase Details
Closed on
Sep 9, 1971
Sold by
Butler Boyce
Bought by
Durham Joe V
Create a Home Valuation Report for This Property
The Home Valuation Report is an in-depth analysis detailing your home's value as well as a comparison with similar homes in the area
Home Values in the Area
Average Home Value in this Area
Purchase History
| Date | Buyer | Sale Price | Title Company |
|---|---|---|---|
| Simons Vernon N | $205,000 | -- | |
| Simons Vernon N | -- | -- | |
| Simons Vernon N | -- | -- | |
| Simons Vernon N | -- | -- | |
| Gibson Wayne | $91,000 | -- | |
| Pinson Eleanor | $87,500 | -- | |
| Durham Joe V | $27,500 | -- |
Source: Public Records
Mortgage History
| Date | Status | Borrower | Loan Amount |
|---|---|---|---|
| Open | Simons Vernon N | $201,286 |
Source: Public Records
Tax History Compared to Growth
Tax History
| Year | Tax Paid | Tax Assessment Tax Assessment Total Assessment is a certain percentage of the fair market value that is determined by local assessors to be the total taxable value of land and additions on the property. | Land | Improvement |
|---|---|---|---|---|
| 2025 | $4,230 | $136,456 | $10,080 | $126,376 |
| 2024 | $4,152 | $126,136 | $10,080 | $116,056 |
| 2023 | $3,696 | $111,908 | $10,080 | $101,828 |
| 2022 | $2,686 | $107,948 | $10,080 | $97,868 |
| 2021 | $2,257 | $98,668 | $10,080 | $88,588 |
| 2020 | $2,615 | $81,388 | $10,080 | $71,308 |
| 2019 | $2,626 | $81,388 | $10,080 | $71,308 |
| 2018 | $3,107 | $81,388 | $10,080 | $71,308 |
| 2017 | $2,639 | $69,127 | $10,080 | $59,047 |
| 2016 | $2,154 | $69,127 | $10,080 | $59,047 |
| 2015 | -- | $69,127 | $10,080 | $59,047 |
| 2014 | -- | $69,127 | $10,080 | $59,047 |
| 2013 | -- | $69,127 | $10,080 | $59,047 |
Source: Public Records
Map
Nearby Homes
- 125 Elm St
- 280 May Ave
- Lot 32 Eagle Point
- 118 Humphrey St
- 202 Goshen St
- 125 Goshen St
- 1118 Augusta Hwy
- 0 Watson St
- 168 Watson Street Extension
- 168 Ext Watson St
- Na Metasville Rd
- 570 Wallace-Wells Cir
- 116 Jackie Way
- 200 Cathy Way
- 00A Elberton Hwy
- LOT 4 Elberton Hwy
- Lot 3a Elberton Hwy
- Lot 32 Petersburg Place
- 1460 Leathersville Rd
- 32 Eagle Pointe