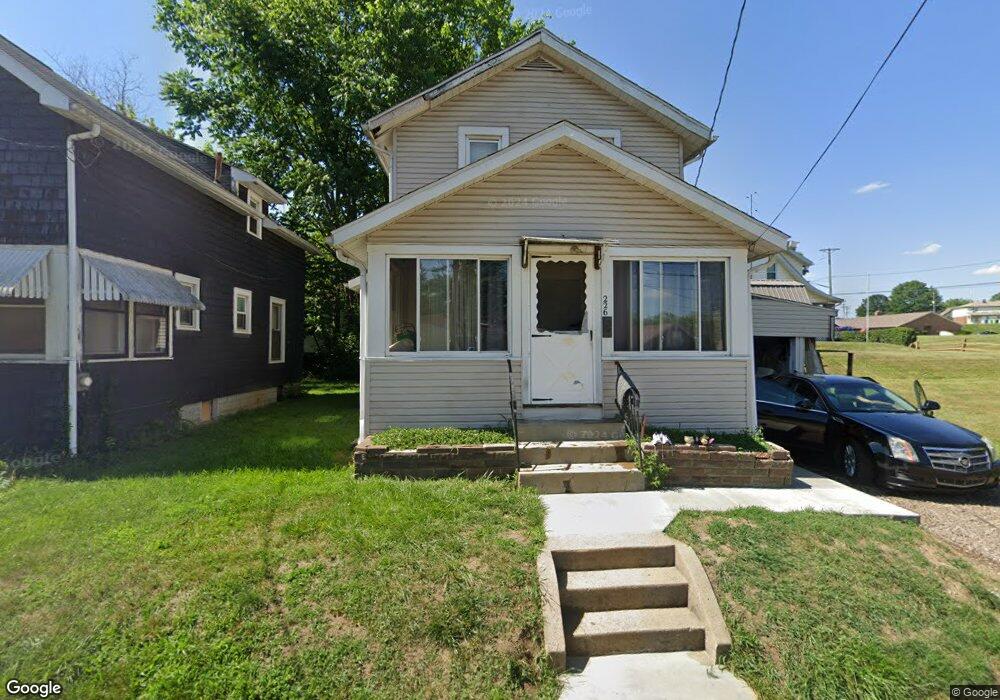
226 Ideal Ct SE Massillon, OH 44646
Downtown Massillon NeighborhoodEstimated Value: $66,600 - $116,000
2
Beds
1
Bath
912
Sq Ft
$102/Sq Ft
Est. Value
About This Home
This home is located at 226 Ideal Ct SE, Massillon, OH 44646 and is currently estimated at $92,650, approximately $101 per square foot. 226 Ideal Ct SE is a home located in Stark County with nearby schools including Massillon Intermediate School, Massillon Junior High School, and Washington High School.
Ownership History
Date
Name
Owned For
Owner Type
Purchase Details
Closed on
May 29, 2010
Sold by
Baker Verdella M
Bought by
Baker Family Of Ideal Court Se Llc
Current Estimated Value
Purchase Details
Closed on
May 28, 2010
Sold by
Baker Family Of Ideal Court S E Llc
Bought by
Baker Verdella M
Purchase Details
Closed on
Jul 7, 2006
Sold by
Baker Verdella M
Bought by
Baker Family Of Ideal Court Se Llc
Purchase Details
Closed on
May 22, 2003
Sold by
Baker Jimmy L and Baker Verdella M
Bought by
Baker Jimmy L and Baker Verdella M
Create a Home Valuation Report for This Property
The Home Valuation Report is an in-depth analysis detailing your home's value as well as a comparison with similar homes in the area
Home Values in the Area
Average Home Value in this Area
Purchase History
| Date | Buyer | Sale Price | Title Company |
|---|---|---|---|
| Baker Family Of Ideal Court Se Llc | -- | None Available | |
| Baker Verdella M | -- | Attorney | |
| Baker Family Of Ideal Court Se Llc | -- | None Available | |
| Baker Jimmy L | -- | -- |
Source: Public Records
Tax History
| Year | Tax Paid | Tax Assessment Tax Assessment Total Assessment is a certain percentage of the fair market value that is determined by local assessors to be the total taxable value of land and additions on the property. | Land | Improvement |
|---|---|---|---|---|
| 2025 | $1,530 | $20,690 | $2,840 | $17,850 |
| 2024 | -- | $20,690 | $2,840 | $17,850 |
| 2023 | $991 | $12,290 | $1,930 | $10,360 |
| 2022 | $531 | $12,290 | $1,930 | $10,360 |
| 2021 | $448 | $12,290 | $1,930 | $10,360 |
| 2020 | $49 | $9,530 | $1,580 | $7,950 |
| 2019 | $10 | $9,530 | $1,580 | $7,950 |
| 2018 | $48 | $9,530 | $1,580 | $7,950 |
| 2017 | $1,793 | $7,220 | $880 | $6,340 |
| 2016 | $2,352 | $8,610 | $700 | $7,910 |
| 2015 | $890 | $8,610 | $700 | $7,910 |
| 2014 | $1,384 | $8,860 | $700 | $8,160 |
| 2013 | $280 | $8,860 | $700 | $8,160 |
Source: Public Records
Map
Nearby Homes
- 23 Arch Ave SE
- 0 Pearl SE Unit 5171879
- 62 Marion Ave SE
- 19 Marion Ave SE
- 383 Mckinley Ave SW
- 1321 Marion Ave SE
- 22 Forest Ave SE
- 20 Forest Ave SE
- 25 Forest Ave SE
- 825 Oak Ave SE
- 21 Forest Ave SE
- 1512 Forest Ave SE
- 533 Webb Ave SW
- 514 4th St SW
- 604 Griffith Ave SW
- 431 5th St SW
- 3414 Joyce Ave NW Unit 18
- Lot 42 Joyce Ave NW
- 3447 Marys Way Ave NW
- 3488 Joyce Ave NW
- 222 Ideal Ct SE
- 1015 3rd St SE
- 1007 3rd St SE
- 227 Dwight Ave SE
- 218 Ideal Ct SE
- 223 Dwight Ave SE
- 1027 3rd St SE
- 219 Dwight Ave SE
- 214 Ideal Ct SE
- 215 Dwight Ave SE
- 210 Ideal Ct SE
- 211 Dwight Ave SE
- 214 Arch Ave SE
- 1033 3rd St SE
- 1022 2nd St SE
- 222 Dwight Ave SE
- 929 3rd St SE
- 218 Dwight Ave SE
- 1026 3rd St SE
- 53440 Arch Ave SE
Your Personal Tour Guide
Ask me questions while you tour the home.