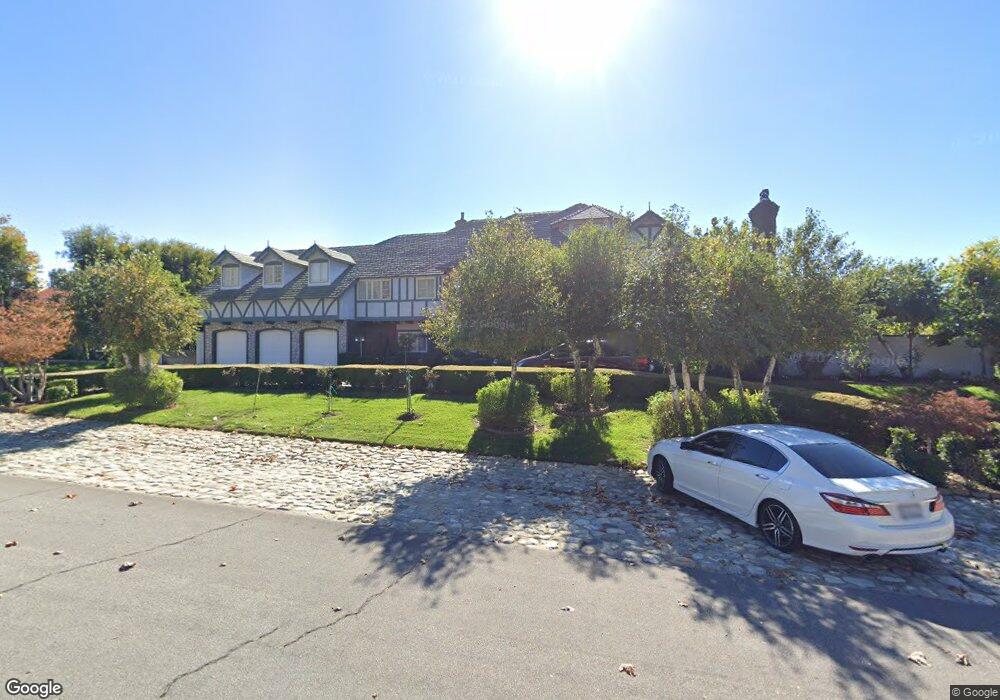
226 Independence Dr Claremont, CA 91711
Northeast Claremont NeighborhoodEstimated Value: $2,282,000 - $2,640,000
5
Beds
5
Baths
6,766
Sq Ft
$364/Sq Ft
Est. Value
About This Home
This home is located at 226 Independence Dr, Claremont, CA 91711 and is currently estimated at $2,460,462, approximately $363 per square foot. 226 Independence Dr is a home located in Los Angeles County with nearby schools including Condit Elementary School, El Roble Intermediate School, and Claremont High School.
Ownership History
Date
Name
Owned For
Owner Type
Purchase Details
Closed on
Sep 17, 2018
Sold by
Ahmed Abdul Mateen
Bought by
Ahmed Abdul Mateen and Ahmed Rafat
Current Estimated Value
Purchase Details
Closed on
Dec 21, 2010
Sold by
Khan Bilal A
Bought by
Ahmed Omrana
Purchase Details
Closed on
Dec 12, 1997
Sold by
Lo Dobbin P
Bought by
Ahmed Abdul Mateen and Ahmed Rafat
Home Financials for this Owner
Home Financials are based on the most recent Mortgage that was taken out on this home.
Original Mortgage
$650,000
Interest Rate
7.14%
Purchase Details
Closed on
Aug 4, 1995
Sold by
Lo Dobbin
Bought by
Lo Dobbin and Lo Teresa
Create a Home Valuation Report for This Property
The Home Valuation Report is an in-depth analysis detailing your home's value as well as a comparison with similar homes in the area
Home Values in the Area
Average Home Value in this Area
Purchase History
| Date | Buyer | Sale Price | Title Company |
|---|---|---|---|
| Ahmed Abdul Mateen | -- | None Available | |
| Ahmed Abdul Mateen | -- | None Available | |
| Ahmed Abdul Mateen | -- | None Available | |
| Ahmed Omrana | -- | Accommodation | |
| Ahmed Omar | -- | Accommodation | |
| Ahmed Abdul Mateen | -- | Accommodation | |
| Ahmed Abdul Mateen | $900,000 | First American Title Co | |
| Lo Dobbin | -- | -- |
Source: Public Records
Mortgage History
| Date | Status | Borrower | Loan Amount |
|---|---|---|---|
| Closed | Ahmed Abdul Mateen | $650,000 | |
| Closed | Ahmed Abdul Mateen | $150,000 |
Source: Public Records
Tax History Compared to Growth
Tax History
| Year | Tax Paid | Tax Assessment Tax Assessment Total Assessment is a certain percentage of the fair market value that is determined by local assessors to be the total taxable value of land and additions on the property. | Land | Improvement |
|---|---|---|---|---|
| 2025 | $17,788 | $1,442,607 | $399,181 | $1,043,426 |
| 2024 | $17,788 | $1,414,321 | $391,354 | $1,022,967 |
| 2023 | $17,327 | $1,386,590 | $383,681 | $1,002,909 |
| 2022 | $17,059 | $1,359,403 | $376,158 | $983,245 |
| 2021 | $16,787 | $1,332,749 | $368,783 | $963,966 |
| 2019 | $16,021 | $1,293,221 | $357,846 | $935,375 |
| 2018 | $15,382 | $1,267,865 | $350,830 | $917,035 |
| 2017 | $14,984 | $1,243,005 | $343,951 | $899,054 |
| 2016 | $14,295 | $1,218,633 | $337,207 | $881,426 |
| 2015 | $14,090 | $1,200,329 | $332,142 | $868,187 |
| 2014 | $13,978 | $1,176,817 | $325,636 | $851,181 |
Source: Public Records
Map
Nearby Homes
- 212 Independence Dr
- 108 Limestone Rd
- 462 Pomello Dr
- 426 E Holyoke Place
- 2305 Bonnie Brae Ave
- 214 Lamar Dr
- 284 Lamar Dr
- 2230 La Crosse Cir
- 2123 Bonnie Brae Ave
- 4064 Olive Knoll Place
- 0 Vl-8675022001 Unit HD25033094
- 0 0 Unit CV25018662
- 107 Evergreen Ln
- 335 - 337 Harvard Ave
- 121 Evergreen Ln
- 972 Olympic Ct
- 207 E Blue Mountain Way
- 750 Charleston Dr
- 1047 Pomello Dr
- 795 Marlboro Ct
- 155 Limestone Rd
- 145 Limestone Rd
- 270 Independence Dr
- 163 Limestone Rd
- 137 Limestone Rd
- 177 Limestone Rd
- 223 Independence Dr
- 129 Limestone Rd
- 249 Independence Dr
- 183 Limestone Rd
- 123 Limestone Rd
- 158 Limestone Rd
- 148 Limestone Rd
- 0 Dillard Ave
- 140 Limestone Rd
- 164 Limestone Rd
- 318 Independence Dr
- 3655 Dillard Ave
- 178 Limestone Rd
- 189 Limestone Rd