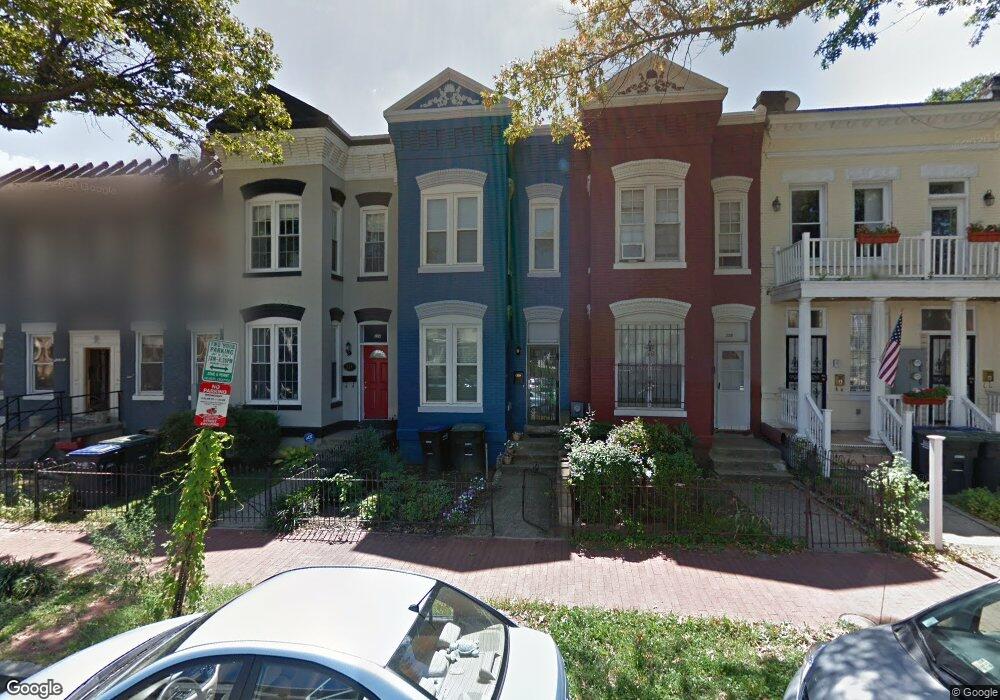
226 P St NW Washington, DC 20001
Truxton Circle NeighborhoodEstimated Value: $555,000 - $707,445
3
Beds
2
Baths
1,354
Sq Ft
$449/Sq Ft
Est. Value
About This Home
This home is located at 226 P St NW, Washington, DC 20001 and is currently estimated at $607,815, approximately $448 per square foot. 226 P St NW is a home located in District of Columbia with nearby schools including Walker-Jones Education Campus, Dunbar High School, and DC Prep Public Charter School - Anacostia Middle Campus.
Ownership History
Date
Name
Owned For
Owner Type
Purchase Details
Closed on
Oct 29, 2021
Sold by
Killiany Joseph W and Boivie Ilana R
Bought by
Killiany Joseph William and Boivie Ilana Ruth
Current Estimated Value
Home Financials for this Owner
Home Financials are based on the most recent Mortgage that was taken out on this home.
Original Mortgage
$495,000
Outstanding Balance
$450,946
Interest Rate
2.88%
Mortgage Type
New Conventional
Estimated Equity
$156,869
Purchase Details
Closed on
Oct 28, 2021
Sold by
Killiany Joseph William and Boivie Ilana Ruth
Bought by
Boi Killiany Revocable Trust and Killiany
Home Financials for this Owner
Home Financials are based on the most recent Mortgage that was taken out on this home.
Original Mortgage
$495,000
Outstanding Balance
$450,946
Interest Rate
2.88%
Mortgage Type
New Conventional
Estimated Equity
$156,869
Purchase Details
Closed on
Feb 12, 2010
Sold by
Maldonado Luz
Bought by
Killiany Joseph W and Boivie Ilana R
Home Financials for this Owner
Home Financials are based on the most recent Mortgage that was taken out on this home.
Original Mortgage
$294,550
Interest Rate
5.5%
Mortgage Type
FHA
Purchase Details
Closed on
Mar 9, 2007
Sold by
Guerrero Hilda
Bought by
Maldonado Camelia
Create a Home Valuation Report for This Property
The Home Valuation Report is an in-depth analysis detailing your home's value as well as a comparison with similar homes in the area
Home Values in the Area
Average Home Value in this Area
Purchase History
| Date | Buyer | Sale Price | Title Company |
|---|---|---|---|
| Killiany Joseph William | -- | None Available | |
| Boi Killiany Revocable Trust | -- | Allied Title | |
| Killiany Joseph W | $300,000 | -- | |
| Maldonado Camelia | -- | -- |
Source: Public Records
Mortgage History
| Date | Status | Borrower | Loan Amount |
|---|---|---|---|
| Open | Killiany Joseph William | $495,000 | |
| Closed | Boi Killiany Revocable Trust | $495,000 | |
| Previous Owner | Killiany Joseph W | $294,550 |
Source: Public Records
Tax History
| Year | Tax Paid | Tax Assessment Tax Assessment Total Assessment is a certain percentage of the fair market value that is determined by local assessors to be the total taxable value of land and additions on the property. | Land | Improvement |
|---|---|---|---|---|
| 2025 | $4,824 | $657,330 | $468,460 | $188,870 |
| 2024 | $4,798 | $651,560 | $466,130 | $185,430 |
| 2023 | $4,671 | $644,620 | $460,590 | $184,030 |
| 2022 | $4,288 | $611,270 | $437,800 | $173,470 |
| 2021 | $3,916 | $600,810 | $433,460 | $167,350 |
| 2020 | $3,565 | $590,470 | $428,670 | $161,800 |
| 2019 | $3,248 | $560,920 | $407,750 | $153,170 |
| 2017 | $2,701 | $493,870 | $0 | $0 |
| 2016 | $2,462 | $434,600 | $0 | $0 |
Source: Public Records
Map
Nearby Homes
- 300 P St NW
- 213 Bates St NW Unit 1
- 122 Bates St NW
- 1427 New Jersey Ave NW
- 1501 4th St NW Unit 1
- 401 O St NW
- 1419 1st St NW
- 403 O St NW
- 304 Q St NW Unit 1
- 1545 4th St NW
- 1325 1st St NW
- 216 N St NW
- 55 P St NW
- 55 Q St NW
- 304 N St NW
- 51 P St NW
- 1249 4th St NW
- 1608 4th St NW
- 1610 4th St NW
- 1240 4th St NW Unit 300
- 228 P St NW
- 224 P St NW
- 230 P St NW
- 230 P St NW
- 230 P St NW Unit A
- 230 P St NW Unit B UPSTAIRS
- 230 P St NW Unit A SECOND FLOOR
- 230 P St NW Unit B
- 220 P St NW Unit TH1
- 220 P St NW
- 220 P St NW Unit 4
- 220 P St NW Unit 5
- 220 P St NW Unit 1
- 220 P St NW Unit 2
- 232 P St NW
- 218 P St NW
- 234 P St NW
- 216 P St NW
- 236 P St NW
- 214 P St NW
Your Personal Tour Guide
Ask me questions while you tour the home.