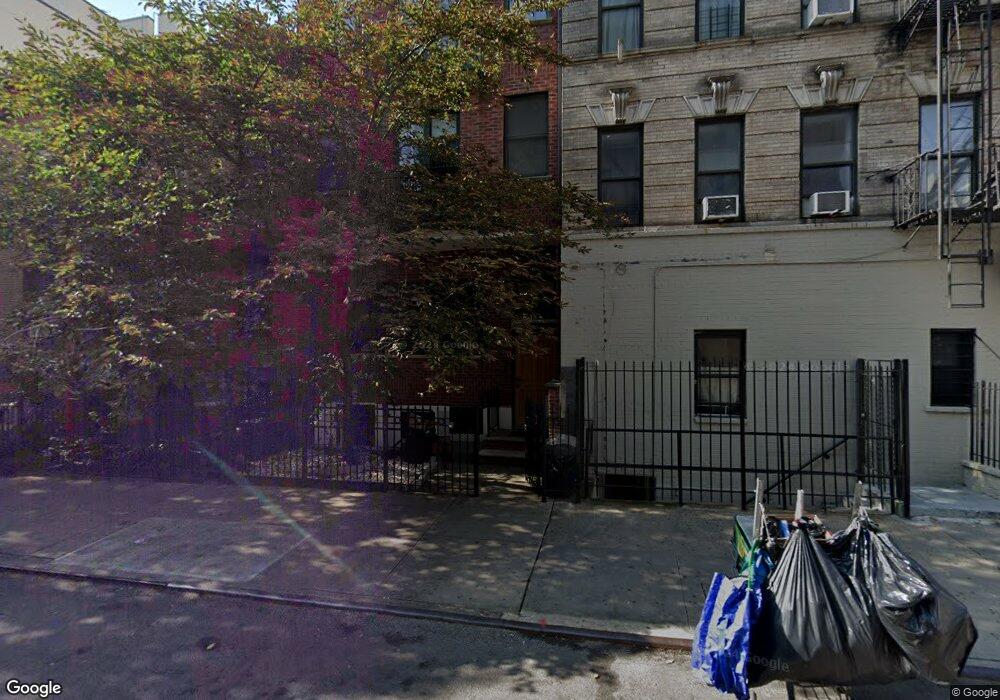
226 S 2 Nd St Unit 2 New York City, NY 11211
Williamsburg NeighborhoodEstimated Value: $2,419,000 - $3,292,000
--
Bed
3
Baths
2,062
Sq Ft
$1,376/Sq Ft
Est. Value
About This Home
This home is located at 226 S 2 Nd St Unit 2, New York City, NY 11211 and is currently estimated at $2,836,957, approximately $1,375 per square foot. 226 S 2 Nd St Unit 2 is a home located in Kings County with nearby schools including P.S. 17 Henry D Woodworth, Success Academy Williamsburg, and United Talmudic Academy- UTA Satmar.
Ownership History
Date
Name
Owned For
Owner Type
Purchase Details
Closed on
Jun 10, 2021
Sold by
Parker Adam R
Bought by
Jewett Alexandra and Pujji Avneet
Current Estimated Value
Home Financials for this Owner
Home Financials are based on the most recent Mortgage that was taken out on this home.
Original Mortgage
$1,827,500
Outstanding Balance
$1,654,573
Interest Rate
2.9%
Mortgage Type
Purchase Money Mortgage
Estimated Equity
$1,182,384
Purchase Details
Closed on
Nov 2, 2017
Sold by
Theis Marcus
Bought by
Parker Adam R
Home Financials for this Owner
Home Financials are based on the most recent Mortgage that was taken out on this home.
Original Mortgage
$1,267,000
Interest Rate
3.83%
Mortgage Type
Purchase Money Mortgage
Purchase Details
Closed on
Jul 9, 2004
Sold by
South Properties Llc
Bought by
Theis Marcus
Home Financials for this Owner
Home Financials are based on the most recent Mortgage that was taken out on this home.
Original Mortgage
$182,400
Interest Rate
6.28%
Create a Home Valuation Report for This Property
The Home Valuation Report is an in-depth analysis detailing your home's value as well as a comparison with similar homes in the area
Home Values in the Area
Average Home Value in this Area
Purchase History
| Date | Buyer | Sale Price | Title Company |
|---|---|---|---|
| Jewett Alexandra | $2,150,000 | -- | |
| Parker Adam R | $1,950,000 | -- | |
| Theis Marcus | $941,881 | -- | |
| Theis Marcus | $941,881 | -- |
Source: Public Records
Mortgage History
| Date | Status | Borrower | Loan Amount |
|---|---|---|---|
| Open | Jewett Alexandra | $1,827,500 | |
| Previous Owner | Parker Adam R | $1,267,000 | |
| Previous Owner | Theis Marcus | $182,400 | |
| Previous Owner | Theis Marcus | $650,000 |
Source: Public Records
Tax History Compared to Growth
Tax History
| Year | Tax Paid | Tax Assessment Tax Assessment Total Assessment is a certain percentage of the fair market value that is determined by local assessors to be the total taxable value of land and additions on the property. | Land | Improvement |
|---|---|---|---|---|
| 2025 | $29,508 | $461,033 | $13,859 | $447,174 |
| 2024 | $29,508 | $576,245 | $13,859 | $562,386 |
| 2023 | $26,809 | $480,204 | $13,859 | $466,345 |
| 2022 | $24,759 | $471,889 | $13,859 | $458,030 |
| 2021 | $22,985 | $495,218 | $13,859 | $481,359 |
| 2020 | $11,299 | $480,897 | $13,859 | $467,038 |
| 2019 | $22,898 | $400,793 | $13,859 | $386,934 |
| 2018 | $21,382 | $168,112 | $6,975 | $161,137 |
| 2017 | $19,508 | $155,660 | $7,508 | $148,152 |
| 2016 | $18,277 | $144,131 | $8,691 | $135,440 |
| 2015 | $10,613 | $144,131 | $10,432 | $133,699 |
| 2014 | $10,613 | $139,663 | $12,127 | $127,536 |
Source: Public Records
Map
Nearby Homes
- 230 S 2nd St
- 225 S 3rd St Unit 2
- 227 S 2nd St Unit 6
- 242 S 1st St Unit 2B
- 251 S 3rd St Unit PHA
- 170 S 4th St
- 40 Bleecker St Unit 3H
- 40 Bleecker St Unit 3E
- 277 S 2nd St
- 705 Driggs Ave Unit 13
- 154 S 3rd St Unit 24
- 153 S 4th St Unit 5
- 149 S 4th St Unit 25
- 241 Grand St
- 141 E 3rd St Unit 3I
- 141 E 3rd St Unit 7 A
- 272 S 5th St Unit A2
- 14 Hope St Unit 3F
- 150 S 1st St Unit 2 K
- 280 Metropolitan Ave Unit 5-D
- 226 S 2nd St Unit 2
- 226 S 2nd St Unit 1
- 226 S 2nd St
- 226 S 2 Nd St Unit 1
- 228 S 2nd St
- 228 S 2nd St Unit P
- 228 S 2nd St Unit PARLOR
- 228 S 2nd St Unit GROUND
- 219 Roebling St
- 219 Roebling St
- 219 Roebling St Unit 1
- 219 Roebling St Unit 2
- 219 Roebling St Unit 3
- 221 Roebling St
- 221 Roebling St Unit TH
- 232 S 2nd St Unit GARDEN
- 232 S 2nd St Unit PH
- 232 S 2nd St Unit 3
- 232 S 2nd St Unit 2
- 232 S 2nd St