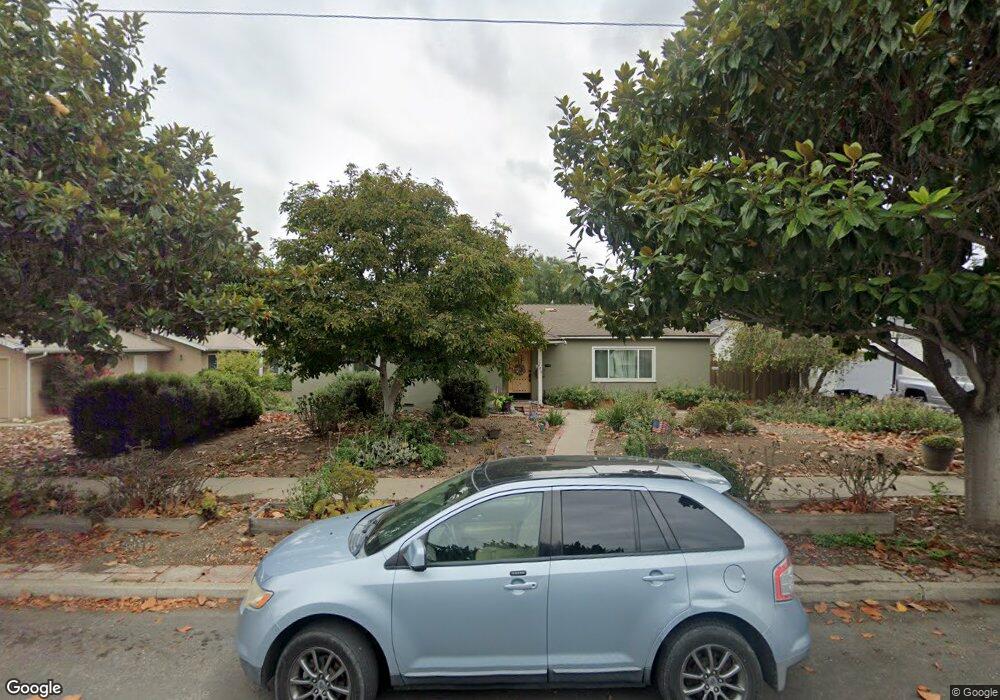
226 S E St Lompoc, CA 93436
Estimated Value: $526,830 - $607,000
3
Beds
1
Bath
1,266
Sq Ft
$438/Sq Ft
Est. Value
About This Home
This home is located at 226 S E St, Lompoc, CA 93436 and is currently estimated at $554,458, approximately $437 per square foot. 226 S E St is a home located in Santa Barbara County with nearby schools including Arthur Hapgood Elementary School, Lompoc Valley Middle School, and Lompoc High School.
Ownership History
Date
Name
Owned For
Owner Type
Purchase Details
Closed on
Mar 12, 2014
Sold by
Hettle Chan Wylie and Wedmore Jessica Robyn
Bought by
Dunne Stephen L and Dunne Charlotte G
Current Estimated Value
Purchase Details
Closed on
Oct 22, 2012
Sold by
Hettle Chan Wylie and Wedmore Jessica Robyn
Bought by
Hettle Chan Wylie and Wedmore Jessica Robyn
Home Financials for this Owner
Home Financials are based on the most recent Mortgage that was taken out on this home.
Original Mortgage
$165,595
Interest Rate
3.43%
Mortgage Type
FHA
Purchase Details
Closed on
Jun 8, 2011
Sold by
Manfrina Barry L
Bought by
Hettle Chan and Wedmore Jessica
Home Financials for this Owner
Home Financials are based on the most recent Mortgage that was taken out on this home.
Original Mortgage
$165,690
Interest Rate
5.5%
Mortgage Type
FHA
Purchase Details
Closed on
Sep 11, 1996
Sold by
Manfrina Joe L
Bought by
Manfrina Joe L
Create a Home Valuation Report for This Property
The Home Valuation Report is an in-depth analysis detailing your home's value as well as a comparison with similar homes in the area
Home Values in the Area
Average Home Value in this Area
Purchase History
| Date | Buyer | Sale Price | Title Company |
|---|---|---|---|
| Dunne Stephen L | $250,000 | First American Title Company | |
| Hettle Chan Wylie | -- | Fidelity National Title | |
| Hettle Chan | $170,000 | Fidelity National Title Co | |
| Manfrina Joe L | -- | -- |
Source: Public Records
Mortgage History
| Date | Status | Borrower | Loan Amount |
|---|---|---|---|
| Previous Owner | Hettle Chan Wylie | $165,595 | |
| Previous Owner | Hettle Chan | $165,690 |
Source: Public Records
Tax History
| Year | Tax Paid | Tax Assessment Tax Assessment Total Assessment is a certain percentage of the fair market value that is determined by local assessors to be the total taxable value of land and additions on the property. | Land | Improvement |
|---|---|---|---|---|
| 2025 | $4,003 | $373,756 | $85,804 | $287,952 |
| 2023 | $4,003 | $359,244 | $82,473 | $276,771 |
| 2022 | $3,931 | $352,201 | $80,856 | $271,345 |
| 2021 | $3,973 | $345,296 | $79,271 | $266,025 |
| 2020 | $3,930 | $341,757 | $78,459 | $263,298 |
| 2019 | $3,864 | $335,057 | $76,921 | $258,136 |
| 2018 | $3,803 | $328,488 | $75,413 | $253,075 |
| 2017 | $3,732 | $322,048 | $73,935 | $248,113 |
| 2016 | $3,664 | $315,735 | $72,486 | $243,249 |
| 2014 | $2,153 | $177,670 | $73,158 | $104,512 |
Source: Public Records
Map
Nearby Homes
Your Personal Tour Guide
Ask me questions while you tour the home.