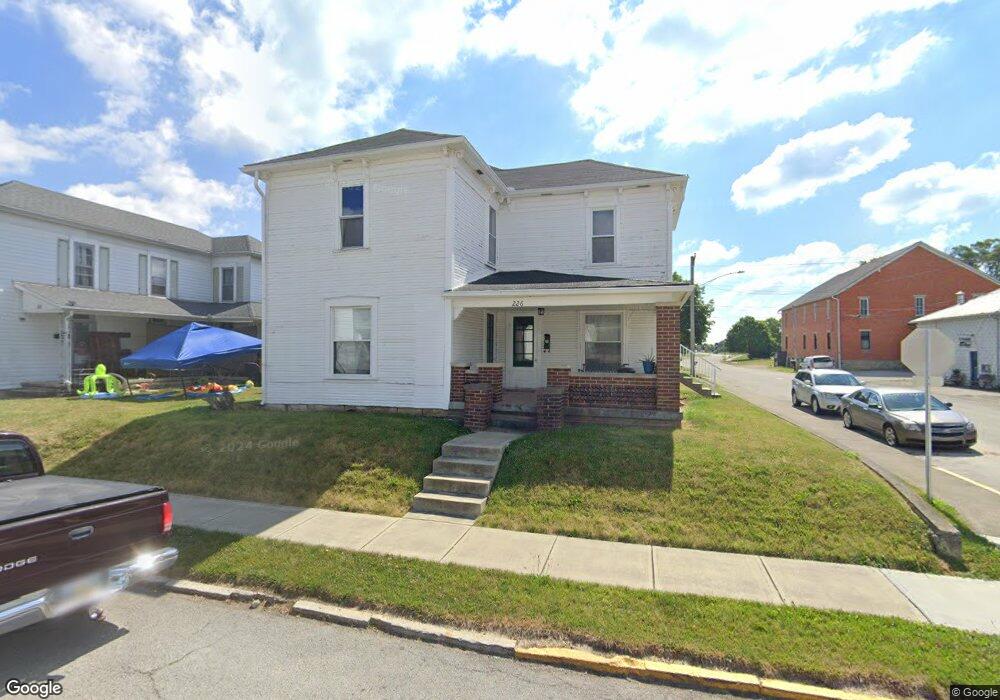
226 S Harrison St Covington, OH 45318
Estimated Value: $167,708 - $231,000
4
Beds
2
Baths
2,048
Sq Ft
$99/Sq Ft
Est. Value
About This Home
This home is located at 226 S Harrison St, Covington, OH 45318 and is currently estimated at $202,677, approximately $98 per square foot. 226 S Harrison St is a home located in Miami County with nearby schools including Covington Elementary/Junior High School, Covington Junior High School, and Covington High School.
Ownership History
Date
Name
Owned For
Owner Type
Purchase Details
Closed on
Dec 20, 2002
Sold by
Kimmel Kimberly R and Kimmel Ryan E
Bought by
Sommer Jason and Sommer Pamela
Current Estimated Value
Home Financials for this Owner
Home Financials are based on the most recent Mortgage that was taken out on this home.
Original Mortgage
$67,050
Outstanding Balance
$27,454
Interest Rate
6.23%
Mortgage Type
New Conventional
Estimated Equity
$175,223
Purchase Details
Closed on
Jul 29, 1999
Sold by
Furrow Jon E and Furrow Sherry A
Bought by
Kimmel Ryan E and Kimmel Kimberly R
Home Financials for this Owner
Home Financials are based on the most recent Mortgage that was taken out on this home.
Original Mortgage
$46,500
Interest Rate
7.69%
Mortgage Type
New Conventional
Purchase Details
Closed on
Jan 13, 1992
Bought by
Furrow Jon E
Create a Home Valuation Report for This Property
The Home Valuation Report is an in-depth analysis detailing your home's value as well as a comparison with similar homes in the area
Home Values in the Area
Average Home Value in this Area
Purchase History
| Date | Buyer | Sale Price | Title Company |
|---|---|---|---|
| Sommer Jason | $74,500 | -- | |
| Kimmel Ryan E | $62,000 | -- | |
| Furrow Jon E | $50,000 | -- |
Source: Public Records
Mortgage History
| Date | Status | Borrower | Loan Amount |
|---|---|---|---|
| Open | Kimmel Ryan E | $67,050 | |
| Previous Owner | Kimmel Ryan E | $46,500 |
Source: Public Records
Tax History
| Year | Tax Paid | Tax Assessment Tax Assessment Total Assessment is a certain percentage of the fair market value that is determined by local assessors to be the total taxable value of land and additions on the property. | Land | Improvement |
|---|---|---|---|---|
| 2025 | $1,708 | $51,140 | $8,820 | $42,320 |
| 2024 | $1,708 | $36,830 | $9,560 | $27,270 |
| 2023 | $1,411 | $36,830 | $9,560 | $27,270 |
| 2022 | $1,408 | $36,830 | $9,560 | $27,270 |
| 2021 | $1,168 | $28,320 | $7,350 | $20,970 |
| 2020 | $1,170 | $28,320 | $7,350 | $20,970 |
| 2019 | $1,176 | $28,320 | $7,350 | $20,970 |
| 2018 | $1,001 | $24,050 | $5,740 | $18,310 |
| 2017 | $1,019 | $24,050 | $5,740 | $18,310 |
| 2016 | $1,006 | $24,050 | $5,740 | $18,310 |
| 2015 | $929 | $23,140 | $5,530 | $17,610 |
| 2014 | $929 | $23,140 | $5,530 | $17,610 |
| 2013 | $897 | $23,140 | $5,530 | $17,610 |
Source: Public Records
Map
Nearby Homes
- 220 S Harrison St
- 214 S Harrison St
- 311 E Bridge St
- 312 E Bridge St
- 221 S Grant St
- 208 S Harrison St
- 224 E Bridge St
- 219 S Harrison St
- 223 E Bridge St
- 313 E Bridge St
- 312 S Harrison St
- 217 S Grant St
- 213 S Harrison St
- 202 S Harrison St
- 207 S Harrison St
- 315 Thompson St
- 309 S Harrison St
- 318 S Harrison St
- 318 S Harrison St Unit Covington
- 317 Thompson St
Your Personal Tour Guide
Ask me questions while you tour the home.