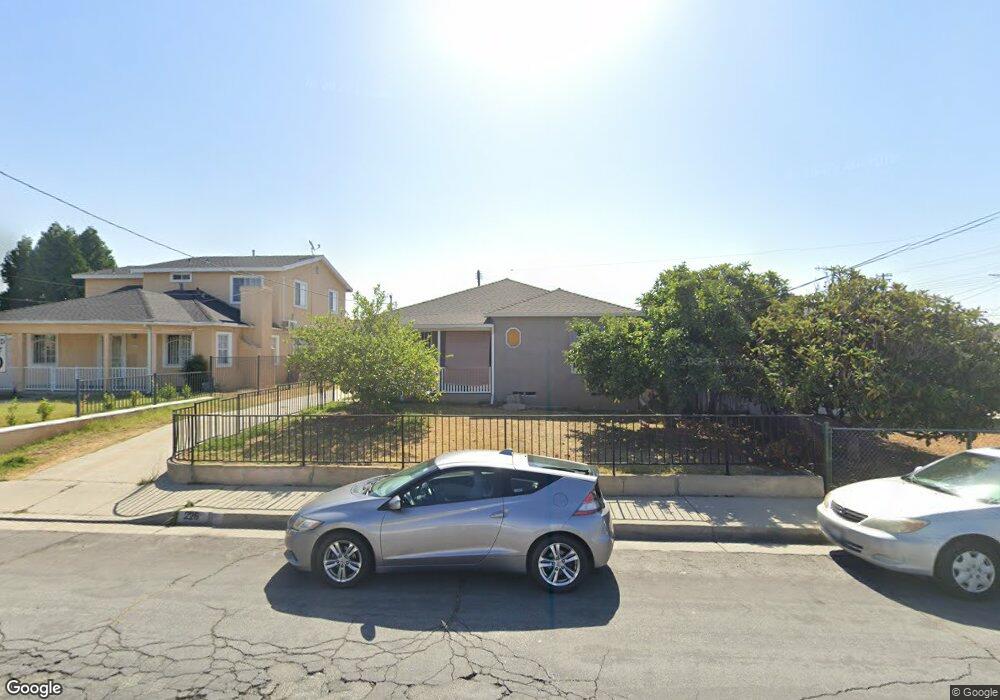
226 S Orange Ave Monterey Park, CA 91755
Estimated Value: $769,566 - $954,000
2
Beds
1
Bath
975
Sq Ft
$893/Sq Ft
Est. Value
About This Home
This home is located at 226 S Orange Ave, Monterey Park, CA 91755 and is currently estimated at $870,392, approximately $892 per square foot. 226 S Orange Ave is a home located in Los Angeles County with nearby schools including Monterey Vista Elementary School, Garvey (Richard) Intermediate School, and Mark Keppel High School.
Ownership History
Date
Name
Owned For
Owner Type
Purchase Details
Closed on
Feb 16, 2019
Sold by
Hong Tong Potong Amy Hong and Hong Joe Gloria
Bought by
Tong Tat Po and Tong Potong Amy Hong
Current Estimated Value
Purchase Details
Closed on
May 2, 2017
Sold by
Hong Hung Peter
Bought by
Tong Potong Amy Hong and Joe Gloria Hong
Purchase Details
Closed on
Jun 23, 2012
Sold by
Hong Hong Yin Yang Yin Yang
Bought by
Tong Potong Amy Hong and Hong Hung Peter
Purchase Details
Closed on
Mar 24, 2012
Sold by
Hong Hong Yin Yang Yin Yang and Pak Kei Hong
Bought by
Hong Hong Yin Yang
Purchase Details
Closed on
Mar 17, 2012
Sold by
Hong Hong Yin Yang Yin Yang and Pak Kei Hong
Bought by
Hong Hong Yin Yang and Survivors Trust Of The Park Kei Hong & H
Purchase Details
Closed on
Jul 19, 1995
Sold by
Hong Pak Kei and Hong Yin Yang
Bought by
Hong Pak Kei
Create a Home Valuation Report for This Property
The Home Valuation Report is an in-depth analysis detailing your home's value as well as a comparison with similar homes in the area
Home Values in the Area
Average Home Value in this Area
Purchase History
| Date | Buyer | Sale Price | Title Company |
|---|---|---|---|
| Tong Tat Po | -- | None Available | |
| Tong Potong Amy Hong | $135,000 | None Available | |
| Tong Potong Amy Hong | -- | None Available | |
| Hong Hong Yin Yang | -- | None Available | |
| Hong Hong Yin Yang | -- | None Available | |
| Hong Pak Kei | -- | -- |
Source: Public Records
Tax History Compared to Growth
Tax History
| Year | Tax Paid | Tax Assessment Tax Assessment Total Assessment is a certain percentage of the fair market value that is determined by local assessors to be the total taxable value of land and additions on the property. | Land | Improvement |
|---|---|---|---|---|
| 2025 | $6,012 | $431,016 | $261,370 | $169,646 |
| 2024 | $6,012 | $422,566 | $256,246 | $166,320 |
| 2023 | $5,813 | $414,281 | $251,222 | $163,059 |
| 2022 | $5,553 | $406,159 | $246,297 | $159,862 |
| 2021 | $5,527 | $398,196 | $241,468 | $156,728 |
| 2019 | $5,324 | $386,387 | $234,307 | $152,080 |
| 2018 | $5,239 | $378,812 | $229,713 | $149,099 |
| 2016 | $4,481 | $336,085 | $192,543 | $143,542 |
| 2015 | $4,393 | $331,037 | $189,651 | $141,386 |
| 2014 | $4,337 | $324,553 | $185,936 | $138,617 |
Source: Public Records
Map
Nearby Homes
- 825 E Newmark Ave Unit A
- 719 E Mabel Ave
- 424 E Newmark Ave Unit B
- 112 S Sierra Vista St
- 412 E Newmark Ave Unit D
- 130 Florence Ave
- 400 S Alhambra Ave
- 527 Pomelo Ave Unit E
- 519 Sefton Ave Unit D
- 531 Sefton Ave
- 524 E Graves Ave Unit A
- 514 S Alhambra Ave Unit 3
- 123 N Alhambra Ave Unit D
- 321 N Orange Ave Unit 209
- 321 N Orange Ave Unit 103
- 1021 Mooney Dr
- 1023 Mooney Dr
- 607 Sefton Ave
- 1121 Whitmore St Unit B
- 208 N Nicholson Ave Unit B
- 232 S Orange Ave
- 222 S Orange Ave
- 234 S Orange Ave
- 216 S Orange Ave
- 238 S Orange Ave
- 212 S Orange Ave
- 717 E Newmark Ave Unit D
- 717 E Newmark Ave Unit C
- 717 E Newmark Ave Unit B
- 717 E Newmark Ave Unit A
- 229 S Orange Ave
- 715 E Newmark Ave Unit E
- 715 E Newmark Ave Unit D
- 715 E Newmark Ave Unit C
- 715 E Newmark Ave Unit B
- 715 E Newmark Ave Unit A
- 225 S Orange Ave
- 233 S Orange Ave
- 239 S Orange Ave
- 221 S Orange Ave