

226 Shillings Chase Dr Cary, NC 27518
Middle Creek NeighborhoodEstimated payment $5,692/month
Total Views
75
4
Beds
3.5
Baths
4,011
Sq Ft
$223
Price per Sq Ft
Highlights
- Heated In Ground Pool
- Clubhouse
- Loft
- Middle Creek Elementary School Rated A-
- Transitional Architecture
- Granite Countertops
About This Home
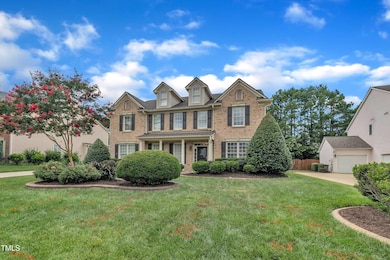
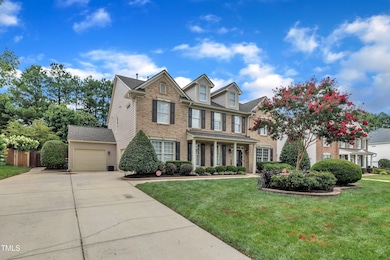
Highly sought-after John Wieland build in Windermere of Cary!
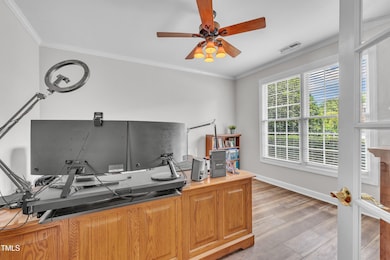
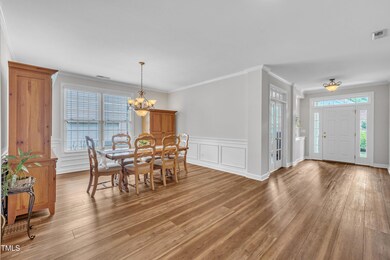
This stunning 4-bedroom, 3.5-bath brick-front home offers over 4,000 square feet of living space, a 3-car garage, and a first-floor office with elegant French doors. Tucked into one of Cary's most desirable communities, this home is made for both relaxation and entertaining—inside and out.
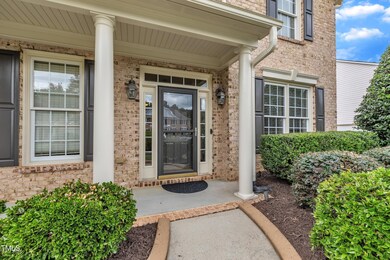
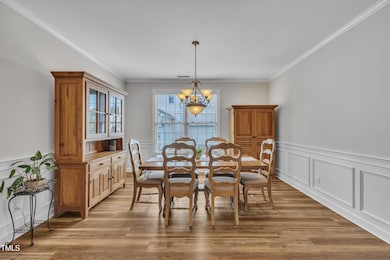
Step into a wide, welcoming foyer which flows from private office to a spacious dining room. The heart of the home is a bright and open kitchen featuring an oversized island, granite countertops, abundant cabinetry, and a walk-in pantry. The kitchen flows seamlessly into a large eat-in area and family room with built-in bookshelves and a cozy gas fireplace—all with beautiful views of your private backyard retreat.
Outside, your own fenced-in oasis awaits: a heated, in-ground gunite pool with waterfall, custom hardscaping, and a covered patio—perfect for making memories with family and friends.
Upstairs, a generous loft provides flexible space for a second living area, playroom, or home gym. The three secondary bedrooms have access to two separate Jack-and-Jill baths, and the spacious primary suite includes trey ceilings, dual walk-in closets, and a spa-like ensuite with separate vanities, soaking tub, and walk-in shower.
Windermere offers a neighborhood clubhouse, pool, basketball courts, and a strong sense of community. All just minutes from major highways, top-rated schools, endless shopping, dining, and everything the Triangle has to offer.
This Cary gem truly has it all—schedule your showing today!
Open House Schedule
-
Saturday, July 19, 202512:00 to 2:00 pm7/19/2025 12:00:00 PM +00:007/19/2025 2:00:00 PM +00:00Add to Calendar
Home Details
Home Type
- Single Family
Est. Annual Taxes
- $7,707
Year Built
- Built in 2002
Lot Details
- 0.3 Acre Lot
- Wood Fence
- Landscaped
- Rectangular Lot
- Back Yard Fenced and Front Yard
HOA Fees
- $93 Monthly HOA Fees
Parking
- 3 Car Attached Garage
- Front Facing Garage
- Side Facing Garage
- Garage Door Opener
- Private Driveway
- Off-Street Parking
Home Design
- Transitional Architecture
- Brick Exterior Construction
- Slab Foundation
- Architectural Shingle Roof
Interior Spaces
- 4,011 Sq Ft Home
- 2-Story Property
- Wired For Sound
- Wired For Data
- Built-In Features
- Bookcases
- Crown Molding
- Tray Ceiling
- Smooth Ceilings
- Ceiling Fan
- Recessed Lighting
- Fireplace
- French Doors
- Entrance Foyer
- Family Room
- Dining Room
- Home Office
- Loft
- Pull Down Stairs to Attic
- Home Security System
Kitchen
- Eat-In Kitchen
- Electric Range
- Microwave
- Kitchen Island
- Granite Countertops
Flooring
- Carpet
- Ceramic Tile
- Luxury Vinyl Tile
Bedrooms and Bathrooms
- 4 Bedrooms
- Walk-In Closet
- Private Water Closet
- Separate Shower in Primary Bathroom
- Soaking Tub
- Bathtub with Shower
- Walk-in Shower
Laundry
- Laundry Room
- Laundry on main level
- Sink Near Laundry
- Electric Dryer Hookup
Pool
- Heated In Ground Pool
- Gunite Pool
- Waterfall Pool Feature
Outdoor Features
- Covered patio or porch
- Exterior Lighting
- Rain Gutters
Schools
- Middle Creek Elementary School
- Dillard Middle School
- Felton Grove High School
Utilities
- Forced Air Zoned Cooling and Heating System
- Heating System Uses Gas
- Heating System Uses Natural Gas
- Underground Utilities
- Natural Gas Connected
- Tankless Water Heater
- High Speed Internet
- Phone Available
- Cable TV Available
Listing and Financial Details
- Assessor Parcel Number 0750885746
Community Details
Overview
- Cas Association, Phone Number (910) 295-3791
- Windemere Subdivision
Amenities
- Clubhouse
Recreation
- Community Pool
Map
Create a Home Valuation Report for This Property
The Home Valuation Report is an in-depth analysis detailing your home's value as well as a comparison with similar homes in the area
Home Values in the Area
Average Home Value in this Area
Tax History
| Year | Tax Paid | Tax Assessment Tax Assessment Total Assessment is a certain percentage of the fair market value that is determined by local assessors to be the total taxable value of land and additions on the property. | Land | Improvement |
|---|---|---|---|---|
| 2024 | $7,540 | $896,855 | $150,000 | $746,855 |
| 2023 | $5,526 | $549,451 | $56,000 | $493,451 |
| 2022 | $5,319 | $549,451 | $56,000 | $493,451 |
| 2021 | $5,212 | $549,451 | $56,000 | $493,451 |
| 2020 | $5,240 | $549,451 | $56,000 | $493,451 |
| 2019 | $4,856 | $451,644 | $63,000 | $388,644 |
| 2018 | $4,556 | $451,644 | $63,000 | $388,644 |
| 2017 | $4,378 | $451,644 | $63,000 | $388,644 |
| 2016 | $4,313 | $451,644 | $63,000 | $388,644 |
| 2015 | $4,745 | $479,987 | $90,000 | $389,987 |
| 2014 | $4,474 | $483,376 | $90,000 | $393,376 |
Source: Public Records
Property History
| Date | Event | Price | Change | Sq Ft Price |
|---|---|---|---|---|
| 07/17/2025 07/17/25 | For Sale | $895,000 | -- | $223 / Sq Ft |
Source: Doorify MLS
Purchase History
| Date | Type | Sale Price | Title Company |
|---|---|---|---|
| Interfamily Deed Transfer | -- | Amrock | |
| Warranty Deed | $318,500 | -- |
Source: Public Records
Mortgage History
| Date | Status | Loan Amount | Loan Type |
|---|---|---|---|
| Open | $390,000 | New Conventional | |
| Closed | $345,468 | VA | |
| Closed | $365,625 | VA | |
| Closed | $368,910 | VA | |
| Closed | $370,500 | Unknown | |
| Closed | $371,000 | Unknown | |
| Closed | $80,000 | Unknown | |
| Closed | $254,700 | Unknown | |
| Closed | $47,750 | Credit Line Revolving | |
| Closed | $47,750 | Credit Line Revolving | |
| Closed | $254,700 | No Value Available |
Source: Public Records
Similar Homes in the area
Source: Doorify MLS
MLS Number: 10109865
APN: 0750.02-88-5746-000
Disclaimer: Certain information contained herein is derived from information provided by parties other than Homes.com. All information provided is deemed reliable, but is not guaranteed to be accurate and should be independently verified.
![]() Some IDX listings have been excluded from this IDX display. Brokers make an effort to deliver accurate information, but buyers should independently verify any information on which they will rely in a transaction. The listing broker shall not be responsible for any typographical errors, misinformation, or misprints, and they shall be held totally harmless from any damages arising from reliance upon this data. This data is provided exclusively for consumers’ personal, non-commercial use. Listings marked with an icon are provided courtesy of the Doorify MLS, Inc. of North Carolina, Internet Data Exchange Database. Closed (sold) listings may have been listed and/or sold by a real estate firm other than the firm(s) featured on this website. Closed data is not available until the sale of the property is recorded in the MLS. Home sale data is not an appraisal, CMA, competitive or comparative market analysis, or home valuation of any property. Copyright 2025 Doorify MLS, Inc. of North Carolina. All rights reserved.
Some IDX listings have been excluded from this IDX display. Brokers make an effort to deliver accurate information, but buyers should independently verify any information on which they will rely in a transaction. The listing broker shall not be responsible for any typographical errors, misinformation, or misprints, and they shall be held totally harmless from any damages arising from reliance upon this data. This data is provided exclusively for consumers’ personal, non-commercial use. Listings marked with an icon are provided courtesy of the Doorify MLS, Inc. of North Carolina, Internet Data Exchange Database. Closed (sold) listings may have been listed and/or sold by a real estate firm other than the firm(s) featured on this website. Closed data is not available until the sale of the property is recorded in the MLS. Home sale data is not an appraisal, CMA, competitive or comparative market analysis, or home valuation of any property. Copyright 2025 Doorify MLS, Inc. of North Carolina. All rights reserved.
Nearby Homes
- 229 Shillings Chase Dr
- 210 Shillings Chase Dr
- 2908 Satori Way
- 216 Pondside Dr
- 3601 Lily Orchard Way
- 2909 Timpani Trail
- 7557 Percussion Dr
- 7561 Percussion Dr
- 7549 Percussion Dr
- 1005 Augustine Trail
- 7804 Percussion Dr
- 7556 Percussion Dr
- 4041 Brook Cross Dr
- 4032 Brook Cross Dr
- 3117 Ten Rd
- 1524 Lily Creek Dr
- 117 Drakewood Place
- 4020 Gumleaf Dr
- 3900 Inkberry Ct
- 107 Sonoma Valley Dr
- 2600 Harvest Creek Place
- 204 Sonoma Valley Dr
- 232 Butterbiggins Ln
- 221 Butterbiggins Ln
- 217 Butterbiggins Ln
- McChesney Hill Loop
- 237 Grenoch Valley Ln
- 8936 Turner Dr
- 4046 Reunion Creek Pkwy
- 4037 Reunion Creek Pkwy
- 748 Wickham Ridge Rd
- 760 Wickham Ridge Rd
- 8804 Holly Springs Rd
- 125 Fairford Dr
- 207 S Carroll St
- 2000 Kiftsgate Ln
- 1000 Brynmar Oaks Dr
- 416 Commons Dr
- 105 Danesway Dr
- 2000 Trellis Pointe Dr